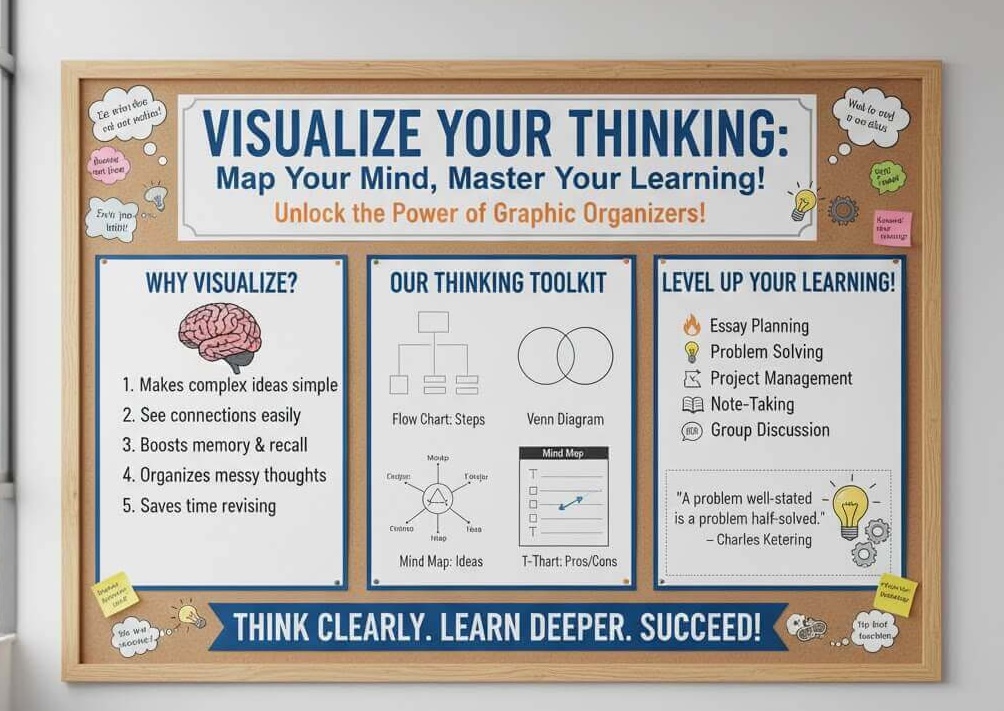
Graphic Organizer Templates
Discover how graphic organiser templates can improve reading comprehension, build vocabulary, and support structured writing across the curriculum.

Discover how graphic organiser templates can improve reading comprehension, build vocabulary, and support structured writing across the curriculum.
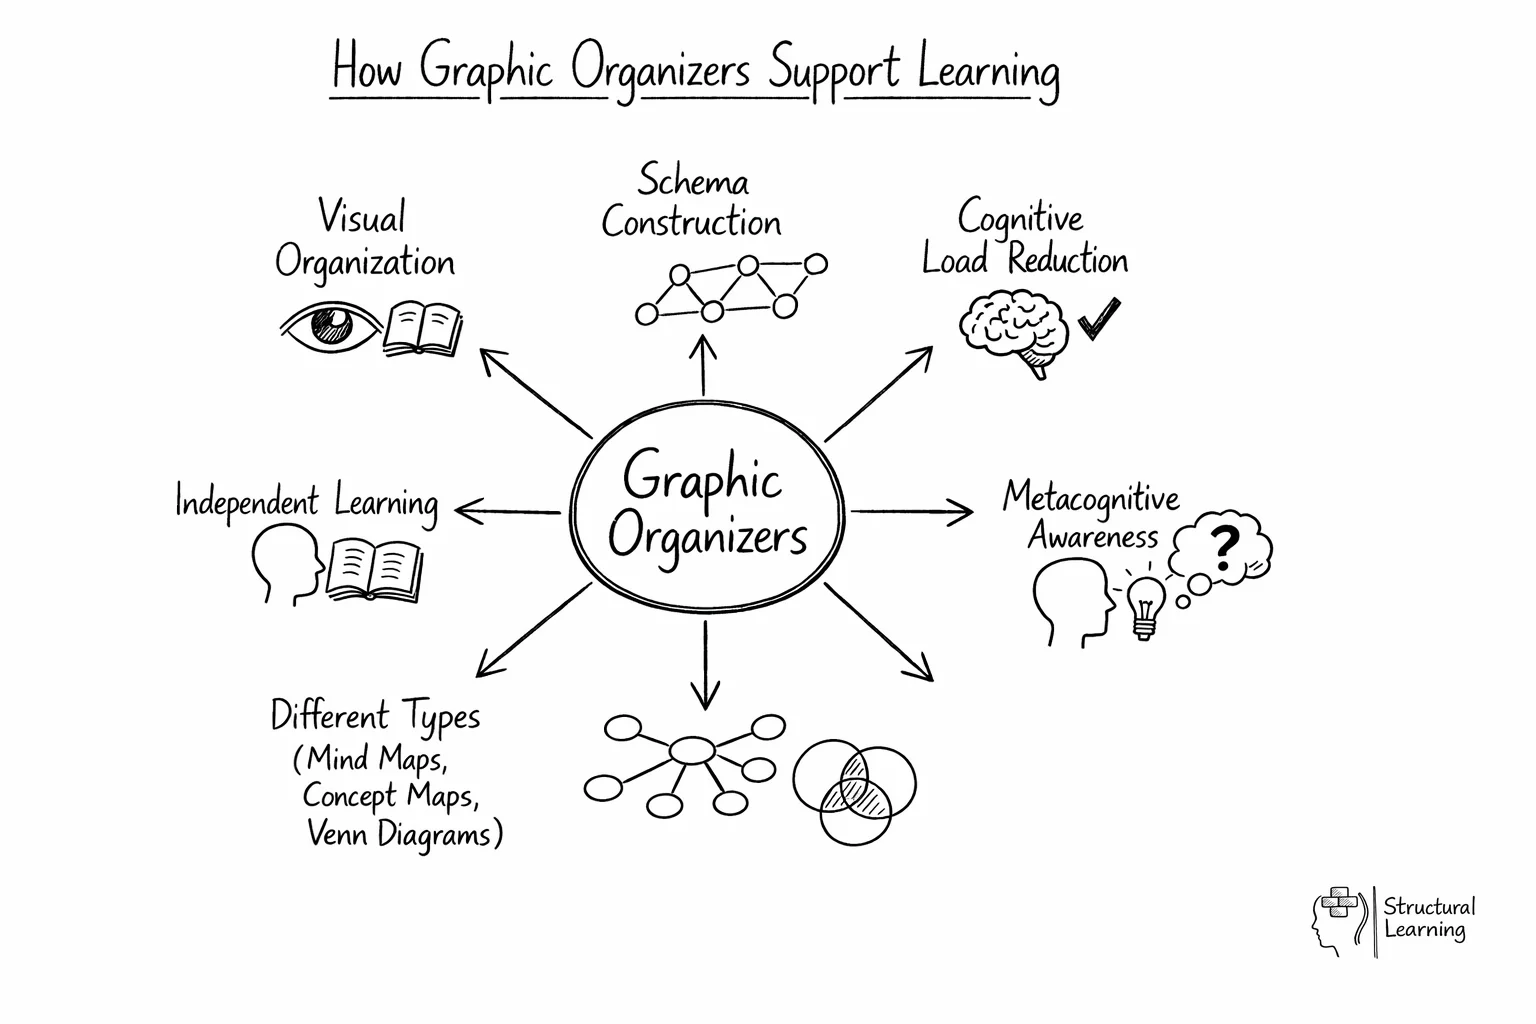
Graphic organisers help learners visually organise information (Paivio, 1971). This makes learning more interesting. They help learners structure information (Novak, 1998). Graphic organisers make abstract ideas concrete, aiding understanding (Ausubel, 1960). They are useful for teaching study skills.
For a broader view of how this fits alongside other classroom methods, see our guide to effective pedagogy.
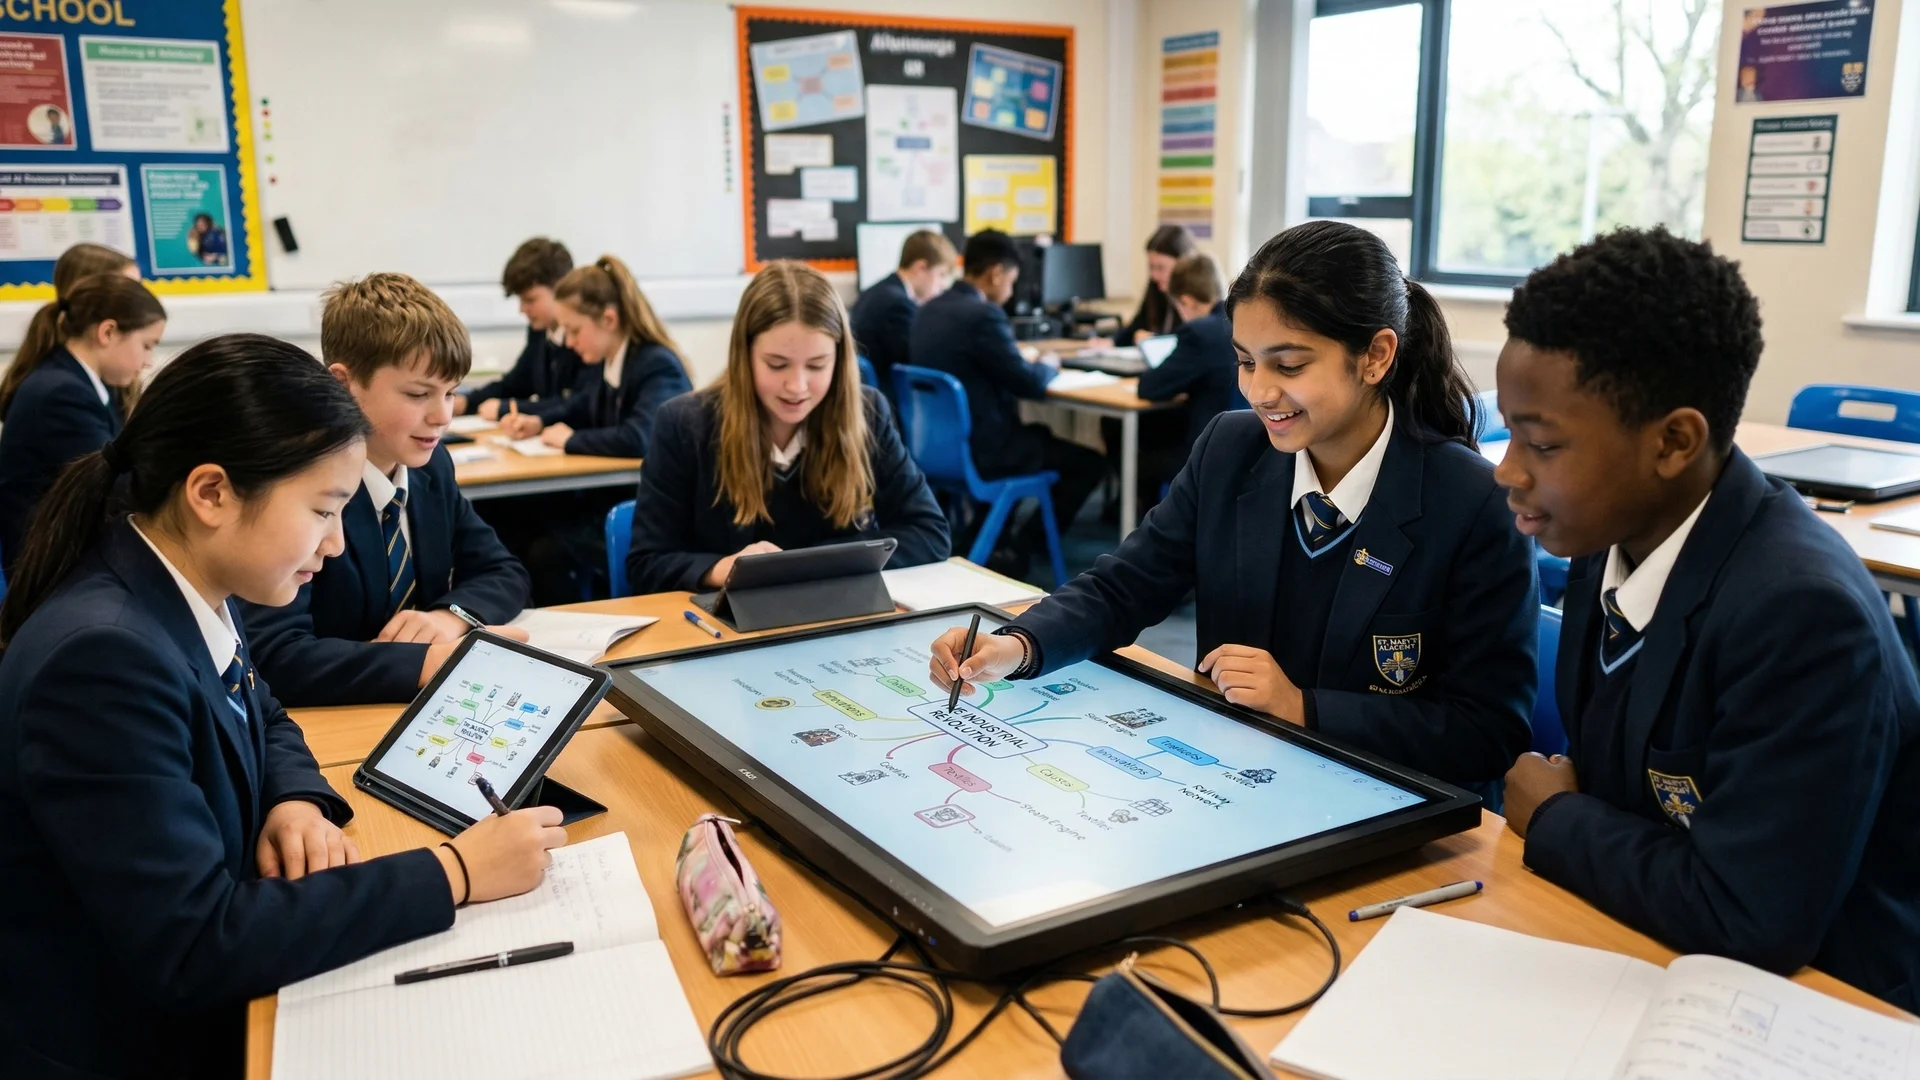
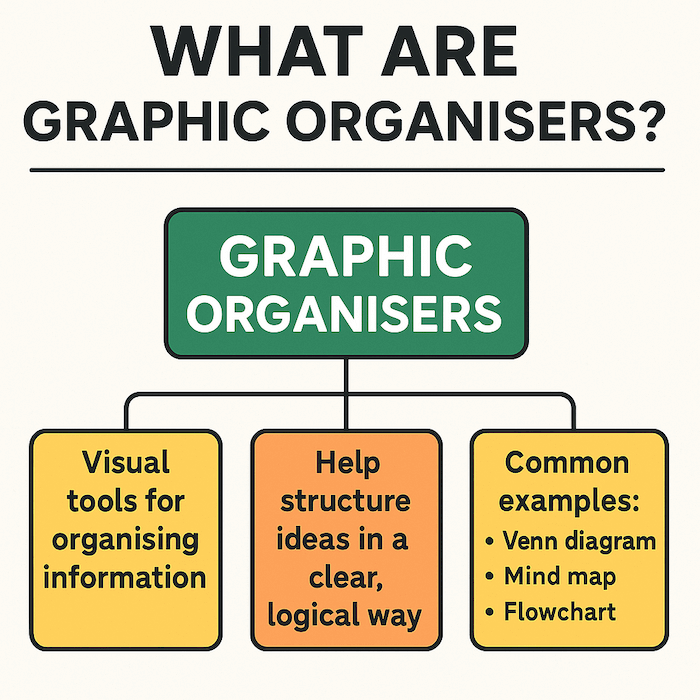
Graphic organisers help learners organise ideas into categories. These frameworks support schema construction, connecting new information to existing knowledge. You can use them for planning academic work and visual learning. Mind maps and Venn diagrams are types of graphic organisers. Mind maps work well for brainstorming, while concept maps analyse data. (Novak & Gowin, 1984; Buzan, 1993; Hyerle, 1996; Clarke, 2005)
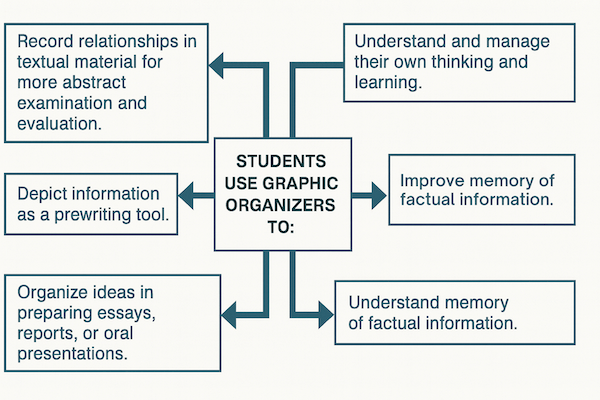
Students use these visual organisers to organise their thoughts before starting to work on assignments. They can then refer back to these images whenever they have trouble recalling what was covered during class. They can be used to help children understand the main idea of an essay, or it could simply be used as a way for you to get your thoughts organised before writing. Graphic organizers have been around since at least the 1950s, and they're still prevalent today. See also: Ai graphic organisers visual thinking.
They work well with any type of text, but we will focus on using them with essays here. Concept maps are different because they are organised visually (generating schema-aligned visuals with AI) instead of verbally. When students complete a concept map, they can look back over the map to recall the main points. Both mind mapping and concept mapping are effective teaching tools because they allow students to focus on specific areas of study rather than having to memorise large amounts of information.
Although a graphic organiser can be used as a way to integrate information with others, a graphic organiser can be used individually for independent learning. This is very effective for learning or listening. It can also be a great way to show support to learners who are learning a topic. Your student should not be expected to create a graphic organiser. They can use a blank, single-page form. Choose your form to fit your needs. A very simple type of graphic organiser is a 'mind map'.
Graphic organizers do exactly what they say; they give learners an opportunity to organise their ideas. Why is this so important? Learning is facilitated by organising information in our minds. To put it bluntly, organising is learning. A graphic organizer is a visual representation of how knowledge is structured. In psychology, we would call this a schema, this is the foundation of how we build understanding. In this article, we are going to focus on how we would go about organising our ideas.
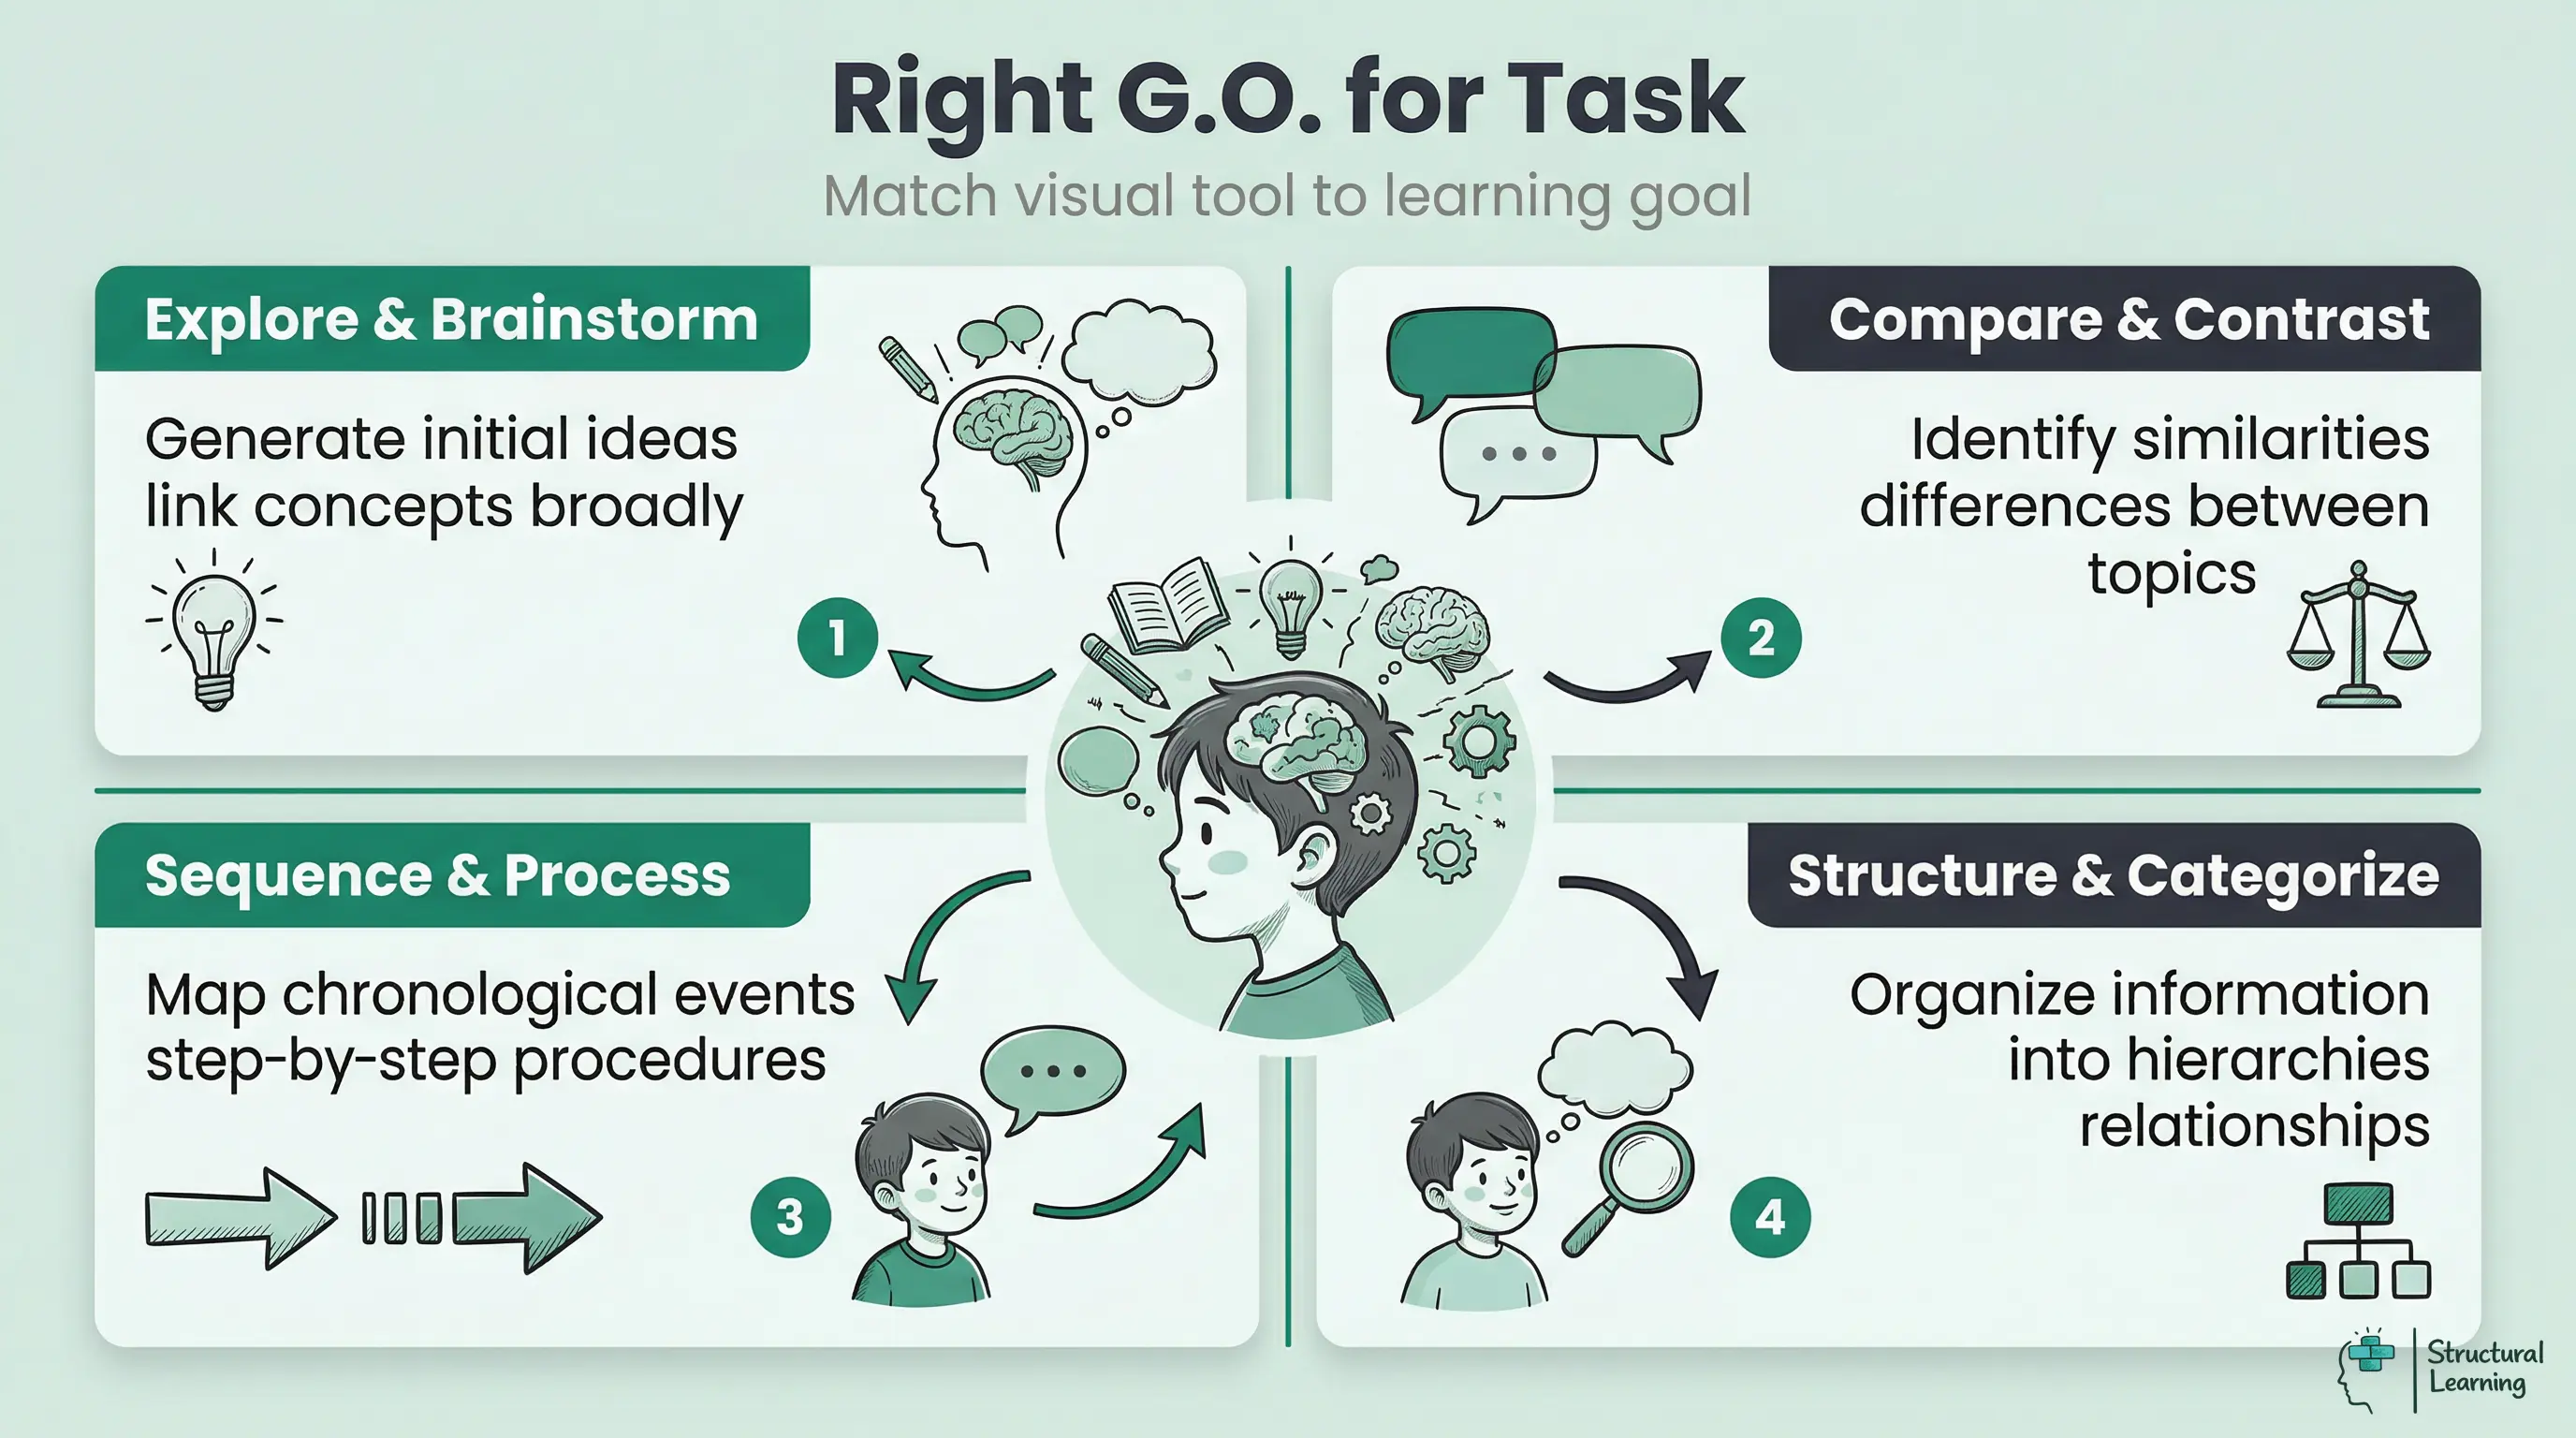
Like a carpenters tool kit, each graphic organizer serves a different purpose. Part of the educator's job is to sift through collections of graphic organizers to find the most suitable one for the job. The visual organizer structure determines how we treat the information we are trying to process. We need to make sure we use the right tool for the right job. For example, if we are comparing two things, we should probably use a Venn diagram. If we are organising information into associated categories, we might want to use the mind map.
The graphic organizer structure is essential and will determine how we eventually write about the content. If we plot historical events using a timeline, we will probably end up using timebase connectives which is central to a recount piece of writing. If students are to be truly independent, they need to understand what the task is asking them to do or, in other words, how are they being asked to organise the information. This metacognitive awareness makes choosing the right cognitive organizer easier.
Organisers may provide information at a glance or allow learners to prepare a discussion or memory exercise. You may want a larger form than a list or list-like organiser and for information to be hand-drawn, on the back of a napkin, or as the exercise progresses. When information is displayed as a visual, it can be easier to keep track of and will give learners an image to work with. A whiteboard may also work if you are willing to supply paper. Organisers help learners focus on what's most important and work through the information as they go.
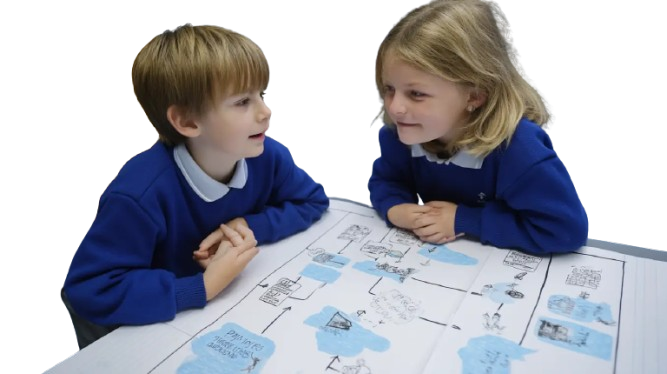
Graphic organisers aid reflection and content creation for all learners. Co-creating them sparks helpful discussions during learning. Some believe they open the door to more profound understanding (Novak & Gowin, 1984; Clarke, 2005; Buzan, 2006).
There are many reasons why teachers like to use graphic organizers when teaching students how to write:
1) Students learn more effectively by organising ideas visually rather than verbally. This makes sense because our brains process visual stimuli faster than verbal ones. When students create a picture out of words, they are forced to think about what each term means individually instead of just thinking about the whole sentence. The result is that they remember the material better after creating the structure.
2) Using graphic organizers forces students to make connections between different parts of the paper. For example, if I ask my student to draw a Venn diagram showing where he/she has learned about the topic from his/her textbook, then I am forcing him/her to connect all these pieces together into one coherent piece. If I were only asking them to list everything without connecting anything, then there would not be much learning going on.
3) By having students create them first, they can see exactly what needs to go where. In other words, they know exactly which part goes next to another part. Without doing this step, they may end up putting things down randomly and never really knowing where to put something until later.
Graphic organisers help learners build knowledge. They support comprehension, (Armbruster & Osborn, 2001). These tools scaffold meaning-making, which involves organising information, (Bromley et al., 1995; Clarke, 2005; Fisher & Frey, 2008).
5) Visual tools promote the knowledge of students. When we use these tools we are building schema, organised packets of information that make retrieval easier. Providing an opportunity for students to get their ideas out of their head and onto paper bypasses the limitations of their relatively small working memories.
Mind maps help learners brainstorm (Novak & Gowin, 1984). Concept maps help learners analyse relationships (Ausubel, 1963). Venn diagrams let learners compare (Venn, 1880). Tree maps show learners hierarchies (Shneiderman, 1991). Teachers should link the right organiser to learning goals.
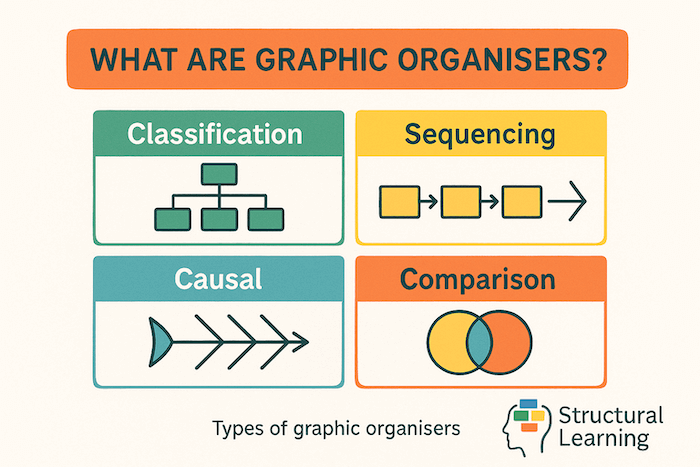
The three most common types of graphic organiser are the hierarchical diagram, the flow chart and the connector form. A hierarchical diagram is a structure that begins with the most general information or concepts in the centre and progress through to the detail or other more specific things down a vertical or horizontal axis.
A flow chart is a diagram that shows the way in which a range of things work together. It might be time-based, for example, or the way that a spreadsheet works. A connector form is the most flexible of the graphic organisers and could be a list of different kinds of information, a specific diagram, or even just a picture. Whether you students are creating a pie chart or documenting historical events using a timeline, the visual nature of the organiser makes complex concepts more accessible.
As we mentioned, choosing the right type of organizer is a skill in itself. Many websites are offering pre-formatted graphic organizers, but simply having a large selection won't help teachers and children. The good news is that there are a few central ways to organise our ideas, and these have corresponding graphics. You don't need anything elaborate, simple black-and-white graphic organizers will do the job. We don't want to distract the learner away from the content, any extraneous load on the working memorymight act as a distraction.
How can we organise information?
There are other organizer types, but the four listed above will cover most writing assignments and child encounters in the curriculum. Specialist tools include:
Graphic organisers help learners manage information and see abstract ideas (Levin & Mayer, 1993). These visuals help learners organise thoughts and recall information more easily. Research by Clark and Dwyer (1991) confirms that clear visual structures improve understanding. This aids learners in identifying links between concepts (Robinson & Kiewra, 1985).
Allan Paivio (1971) suggested dual coding. Oliver Caviglioli (2019) applied it to teaching. This theory says learners remember better when you mix words and pictures.
David Hyerle created a wonderful book entitled 'Visual tools for constructing knowledge. The version that I am looking at now from 1996 looks a bit dated, but the content remains highly relevant. When your students are using a visual tool, they are indeed constructing knowledge. In other words, they are using this pedagogical tool for generating meaning.
In many cases, educators see the graphic organizer as a bridge between brainstorming and pre-writing tools. A child is effectively taking their ideas out of their head and manipulating them in a visual space. This is why tools like a concept diagram or cluster diagram are so powerful. Once a learners ideas are outside of their head, their working memory has been freed up for the essential higher-order thinking needed for generating meaning. The humble graphic organizer will always remain a vital teaching tool.
What sort of diagrams could you use in the classroom?
Clarke (2005) found graphic organisers boost critical thinking. Learners connect ideas actively via discussion, as Marzano (2001) researched. Thinking improves when learners collaborate (Vygotsky, 1978). Learners connect concepts by explaining visual aids (Novak, 1998).
Creative thinking uses structured idea generation. The learner thinks, talks, and connects within a feedback loop. Organise academic topics productively; practice helps learners find the main principles. Visual tools break down complex topics, assisting the learner to build knowledge.
For example, when tackling a history project, you could start with a flow diagram. Students could then use a triple Venn diagram to compare the topic with two other historical events that they are familiar with. Using these popular thinking maps will enable your students to quickly get out of the starting blocks and start creating knowledge.
Teachers need training to choose graphic organizers for each task. Start a pilot program within one year group or subject. Expand based on teacher feedback and set success measures. Give learners templates and digital tools. Establish clear guidelines for using different organizers across subjects.
What can you do to create a graphic organiser? Mind maps and relationship charts are just a few of the different types of graphic organised. Think about the information to be presented and the concept of your course before you make a decision about a graphic organiser. It's a good idea to think about the purpose of the graphic organizers.
The goal is to show the information presented in the lesson in a visual way. A mind map provides a clear structure for your students to put ideas in order to understand them and to see how the information connects with each other. The graphic organizer is viewed as an essential tool for writing projects in many classrooms.
If you are still unsure how graphic organizers help learners with curriculum content, hop over to our extensive organizer library and see how they are categorized. Depending on the type of thinking you want to promote, you will be able to choose from a comprehensive set of effective learning tools that are free from distractive pictures and emojis. If your school is interested in developing a clear agenda for using visual tools, please do get in contact with us. We can talk about developing a strategic approach together.
Graphic organisers help learners understand ideas. Use them to teach essay writing or persuasive writing. Knowledge maps let learners find meaning (Novak, 1998; Buzan, 1993). Visual tools support learning (Ausubel, 1960; Jonassen, 1996).
Tip #1: Embed Visual Tools
Visual tools are one of the most powerful learning strategies available. If you want to improve student performance, then you need to incorporate visual tools into your lesson plans.
For example, if you want to teach students how to write a persuasive essay, then you can show them examples of persuasive essays online. Students can see these persuasive essays and decide whether they agree or disagree with the author's point of view.
This strategy works particularly well for students who struggle with reading comprehension.
Tip #2: Make Them Easy to Understand
When you're trying to teach students how to use graphic organizers, you'll want to make sure that they understand exactly what you mean.
So, make sure that your graphic organizers are clear and concise. For example, if you want students to use a tree diagram to organise information, then make sure that the tree diagram is clearly labelled and that the labels are written in plain English.
Tip #3: Provide Multiple Examples
Graphic organisers aid learners in structuring information. Learners understand proper usage through repeated practice.
For example, you could ask students to create a simple tree diagram to represent a list of items. Then, you could provide them with another set of instructions asking them to create a tree diagram to represent a shopping list.
Afterwards, you could ask them to compare the two trees and explain why each item was placed where it was.
Tip #4: Give Students Time to Practice
Allow students time to practice using graphic organizers. They may not grasp the concept right away. But, over time, they will become proficient at using graphic organizers.
Graphic organisation techniques need practice. Learners should complete several assignments using them. Learners gain confidence using graphic organisers.
Tip #5: Be Flexible
Learners sometimes struggle with instructions. Do not be discouraged. Remember that you gave them chances to practise graphic organisers, (Marzano et al., 2001). Keep supporting their learning.
Remember, learners won't master skills instantly. You are helping them develop critical thinking, as identified by researchers like Ennis (1985) and Facione (1990).
Graphic organisers help learners structure information well. Eysenck (1970) and Paivio (1971) found visuals improve memory. Teach clearly, support learning, and provide practice (Marzano et al., 2001).
Graphic organisers let learners see information clearly. Novak (1998) found that these frameworks clarify abstract ideas. Sweller (1988) showed they help memory and build schemas. Learners then focus on understanding, not just learning by rote (Ausubel, 1960).
The best visual organiser matches your learning goal. Use Venn diagrams to compare concepts. Mind maps help learners brainstorm, say Fisher (2001). Use concept maps for data relationships (Novak, 1998). Timelines sequence events, as suggested by Buzan (1993).
Graphic organisers help learners manage working memory. Visuals process faster than words (Paivio, 1971). Learners connect ideas using these tools. Organisers build knowledge and make recall easier. This helps learners understand concepts better (Novak, 1990; Ausubel, 1963).
Graphic organisers boost metacognition when learners choose them (Marzano, 1998). When learners match a task to a visual, understanding improves greatly (Hattie, 2009). This task awareness builds independent learning (Black & Wiliam, 1998).
Researchers such as Clarke (1991) and Hyerle (1996) found selecting the wrong graphic organiser hinders learner success. Teachers, understand each organiser's purpose. Match the visual structure to what the learner must achieve.
Graphic organisers help learners of all levels, as they visually simplify tricky ideas. They aid learners who find organising thoughts hard (Eppler, 2006). Simple templates let them structure learning, without making their own frameworks (Novak, 1998; Buzan, 2006).
Graphic organisers help learners understand information; they structure it as they read. Bromley et al. (1995) showed these tools connect ideas during writing. Learners produce clearer, better organised work this way (Robinson & Kiewra, 1995; Hall & Strangman, 2002).
Download this free Graphic Organisers School Bundle for your classroom and staff room. Includes printable posters, desk cards, and CPD materials.
A teacher's guide helps with classroom use.
Dual coding theory and education View study ↗2008 citations
Clark and Paivio (1991)
Dual coding theory says people process visual and verbal information together (Paivio, 1971). Graphic organisers help learners because they combine visuals and text. Research by Sadoski and Paivio (2001) supports using visuals to improve learning.
Teaching EFL students to write with ChatGPT: Students' motivation to learn, cognitive load, and satisfaction with the learning process 61 citations
Woo et al. (2024)
AI impacts learner motivation, cognitive load, and satisfaction in English lessons. Teachers should consider cognitive load and engagement when planning resources with graphic organisers.
Pikoli et al. (2021) examined how audio-visual media supports chemistry learning in Indonesian secondary schools. The study suggests that learners benefit when teachers combine visual and verbal modalities, a principle that translates well to designing graphic organisers.
Pikoli et al. (2021)
Learners benefit most from materials that combine visual and verbal information. Teachers can apply this principle when designing graphic organisers that support comprehension across subjects.
Visual aids help learners, according to research. How well they work depends on subject difficulty and individual learning styles. Studies highlight wide variations in how different learners respond.
Qasserras et al. (2024)
Visual tools can help make education fairer. This study shows visual aids increase learner engagement. Felder and Silverman (1988) found differences in learning styles. Gardner's (1983) work on intelligences supports varied teaching. Teachers can use Pashler et al's (2008) research to help learners.
Graphic organisers can support learner reading. Research suggests these tools improve learner understanding and planning skills. This helps with comprehension during reading, supported by studies (26 citations).
Kurniaman et al. (2019)
Graphic organisers help year 4 learners' reading. The research offers teachers ways to create and use graphic organisers well. They are useful tools for reading lessons.