Updated on
July 26, 2026
Visual Learning Strategies: Dual Coding and Graphic
Visual learning draws on Paivio's dual coding theory: combining words and images strengthens memory. Move beyond clip art to graphic organisers, diagrams.


Updated on
July 26, 2026
Visual learning draws on Paivio's dual coding theory: combining words and images strengthens memory. Move beyond clip art to graphic organisers, diagrams.
Visual learning uses graphics to present information, leveraging faster visual processing. Visual sound teaching, for example, links sounds and images. Learners gain knowledge visually, which helps teachers improve understanding and memory. (Paivio, 1971; Mayer, 2009) showed visuals aid learning.
What does the research say? Paivio's (1986) dual coding theory demonstrates that information encoded both verbally and visually is recalled significantly better. Mayer's (2009) multimedia learning research found a median effect size of d = 1.39 for the multimedia principle (words + pictures vs words alone). Hattie (2009) ranks concept mapping at d = 0.60 and visual-spatial displays at d = 0.45. However, Pashler et al. (2008) found no evidence that matching instruction to a learner's "visual learning style" improves outcomes.
(Paivio, 1971). Research by Sadoski and Paivio (2001) expands on this, suggesting combined visual and verbal information creates richer, more memorable learning experiences. Studies by Mayer (2009) further reveal that learners process visual and verbal inputs through separate channels. This dual processing, according to Sweller (1988), reduces cognitive overload, leading to better understanding and retention. REWRITE: Paivio's (1971) Dual Coding Theory says learners absorb information better with words and visuals. Sadoski and Paivio (2001) found combined visuals create memorable learning. Mayer's (2009) studies show learners process words and visuals separately. Sweller (1988) says this reduces overload and aids understanding.
Visual methods like concept maps support different learners (Novak, 1972). Data visualisation and videos also help learners understand concepts (Tufte, 2001; Mayer, 2009). These approaches boost learner engagement and improve academic results (Hattie, 2008).
Visual learning research gives teachers a strong base. It simplifies complex ideas and supports abstract thinking. Visual methods aid spatial skills development (Paivio, 1971; Mayer, 2009). These skills are vital for learners in today's world (Winn, 1993; Uttal et al., 2013).
Visual learning helps learners connect ideas, says research (Science Education). Seeing structures aids knowledge building, according to researchers. We will explore useful classroom strategies for all learners. Use these practical methods based on sound theory.
Researchers like Mayer (2009) show visuals boost learner engagement. Follow best practices from Paivio (1991) and Sweller (1988) for cognitive load. This helps learners meet academic standards, as Clark and Lyons (2011) suggest.
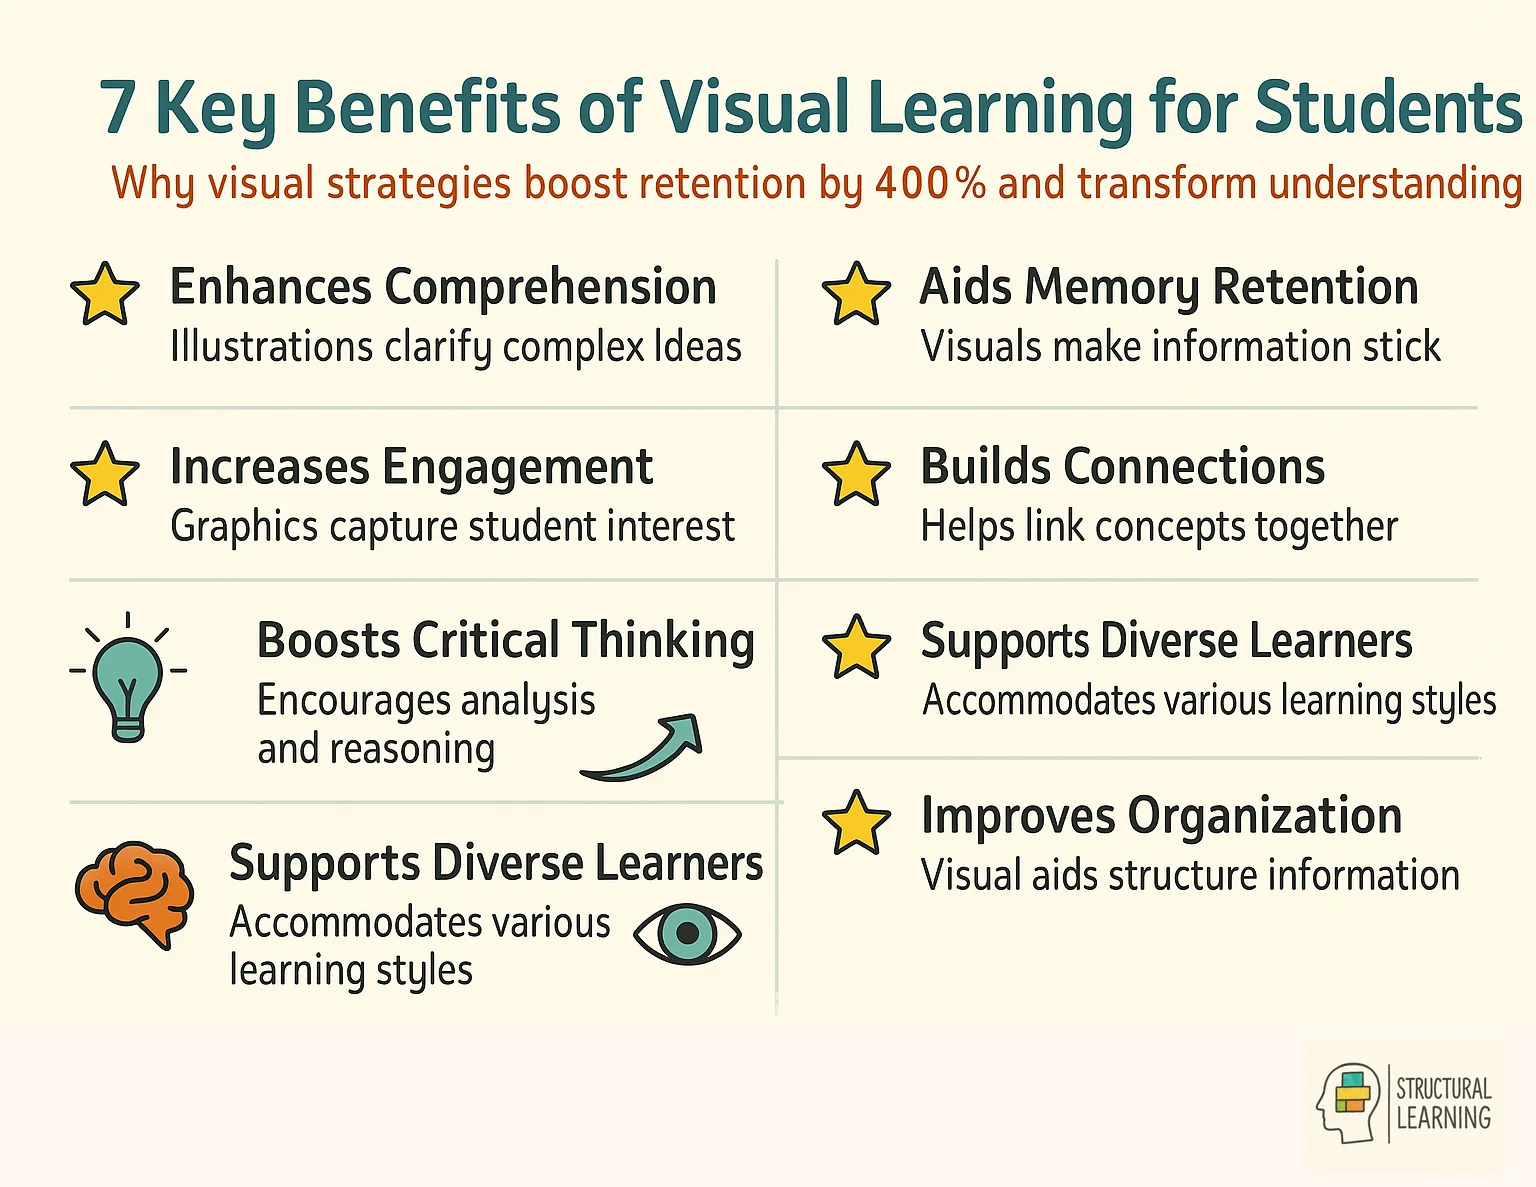
Visual learning boosts retention up to 400% over text alone, speeding up information processing. Learners understand abstract ideas better and remember things longer with visuals. This method helps struggling learners and those with special needs particularly well.
| Strategy | Description | When to Use | Implementation Tips |
|---|---|---|---|
| Graphic Organisers | Visual frameworks for information | Organising complex information | Match organiser type to content |
| Dual Coding | Combine words and images | Presenting new concepts | Keep visuals simple and relevant |
| Mind Maps | Radial diagrams of related ideas | Brainstorming, revision | Start central, branch outwards |
| Timelines | Sequential visual representation | Historical events, processes | Include key dates and images |
| Diagrams & Charts | Visual data representation | Showing relationships, data | Label clearly, avoid clutter |
Visual methods help learners understand better (Paivio, 1971). They boost memory and attention (Mayer, 2009). Visuals clarify complex ideas, said researchers (Clark & Lyons, 2011). Learners retain more when using visual aids (Medina, 2014). Visuals engage different learning styles (Felder & Silverman, 1988). These strategies improve problem-solving (Kosslyn, 1994). Finally, visual tools foster creativity (Wallas, 1926).
Research shows visuals aid learning. Visual strategies help learners move from rote memorisation to analysis (Dwyer, 1978). This shift works across all formal learning stages. Teachers can use visuals to boost understanding.
Visual methods help middle-aged learners. This supports their cognitive development,. Teachers build stronger understanding with these strategies. Learners then apply knowledge across subjects,, easing the load,.
Visual learning uses concept maps and videos effectively. Teachers should add verbal explanations to boost dual coding (Paivio, 1971). This helps all learners and builds their knowledge structures. Visuals aid neurodiverse learners, like those with autism or dyslexia. Feedback and visual retrieval practice improve learning. Begin with simple diagrams, progressing to complex visuals (Clark & Mayer, 2016).
Map It helps learners process information deeply when they make visuals. Research by Novak (1998) and Buzan (2006) supports this. Visual learning, as explored by Paivio (1971), boosts understanding for learners.
Mayer's research shows visuals with words help learners. His cognitive theory of multimedia learning (Mayer, various dates) explains why. Learners process information better when they use more than one sense at once.
Graphic organisers aid learning. Mind maps help learners link ideas (Novak, 1998). Flow charts simplify processes. Venn diagrams let learners compare concepts well (Horton, 2000). Introduce templates before learners create their own (Clarke, 2005).
Interactive visual displays engage learners, not just teach. Word walls should change throughout lessons. Learners can create infographics and concept maps together, boosting engagement and reinforcing points. Displays must have educational purpose and show learning progress.
Visual aids like charts help learners daily. Encourage learners to create concept visuals. Use videos and interactive whiteboards for engaging lessons. Let learners use visual tools in group and individual tasks. This improves understanding and supports varied learning styles (Mayer, 2009; Paivio, 1971).
Visual routines can help learners daily. Display a visual schedule. Encourage learners to use mind maps before writing. These approaches boost learning and improve outcomes (Wiliam, 2011; Christodoulou, 2017).
Pictorial timetables help visual learners with morning routines. Younger learners understand the day's schedule when they see it. Weather charts and calendars aid visual learning. Visual prompts increase morning engagement.
Visual cues aid lesson changes. Traffic lights show noise levels. Timers clarify activity duration. Colour-coded resources boost recognition. This cuts confusion, saving learning time,.
Visual learning needs daily assessment. Quick visual tasks, like exit tickets, check learning. Learners draw summaries, give thumbs up/down, or label diagrams for feedback. These methods are quick to prep and help learners (Wiliam, 2011).
Brains process visuals faster than text (Larkin & Simon, 1987). Allan Paivio's dual coding theory (1971) says we use visual and verbal channels. Visual learning helps learners connect information better.
Sweller's (1988) cognitive load theory shows visuals boost learning. Text-heavy lessons can overload a learner's memory with hard ideas. Good visuals, however, ease this load by structuring information. This helps learners process information and understand it better. Brain scans show visual content activates more brain areas.
Research shows visual aids with words boost learner engagement and memory. Use diagrams with instructions. Colour code concepts. Learners creating visual summaries improves results.
"Learning styles" lack scientific support, yet visuals help learners. Research by Paivio (1971) shows visual aids support all learners. Visual learning strategies are valuable classroom tools (Mayer, 2009). Our brains process visuals quickly (Arnheim, 1969).
Sweller's cognitive load theory (Sweller, date) says visuals boost learning. They lower mental effort by using multiple senses. Diagrams help all learners understand complex ideas better. Teachers can make abstract concepts accessible by pairing them with visuals.
Infographics present concepts well. Flowcharts, helpful for clarity, aid understanding. Colour-coding organises data (Parkinson, 2016). Use visuals in the curriculum, don't label learners (Willingham, 2004). Research shows this engages learners (Mayer, 2009).
Mayer (2009) says standard tests may overlook visual learning benefits. Use concept maps and infographics to assess learners properly. Wiggins (1998) and McTighe (2005) suggest peer assessment of visual work gives feedback.
Paivio's dual coding theory suggests visual and verbal information improves learner recall. Multimedia assessments, like diagrams with writing, show learner understanding. Teachers use checklists to monitor engagement in visual tasks. Note time on task, teamwork, and the quality of visual work.
Success criteria for visual tasks and good examples are key. Use digital portfolios to track learner progress (Wiggins, 1998). This helps teachers and learners see visual literacy and subject knowledge growth over time (Sadik, 2008).
Digital visual tools change teaching; learners engage actively. Multimedia helps learners understand and remember (Mayer, 2009). Whiteboards, tablets, and simulations show concepts visually. These resources can suit each learner's needs (Hattie, 2012; Wiliam, 2011).
Sweller's (1988) cognitive load theory shows digital tools work well. These tools present information in different ways, reducing unnecessary mental effort. Digital visual organisers help learners create knowledge maps together. Augmented reality brings abstract ideas into 3D, as per Johnson et al (2010). These methods help visual learners, noted by Clark & Lyons (2011), who find text difficult.
Visual learning tools work best when they suit teaching goals. Teachers should pick tools which boost learning, not distract learners. Use simple platforms at first, then try complex ones as confidence grows. Check learner engagement and results to see what helps most.
According to Paivio's (1971) dual coding theory, link words with images. This helps the learner remember facts better. Visual learning uses diagrams so learners grasp complicated ideas. Researchers like Mayer (2009) show visual aids help learners understand relationships.
Teachers can start by using graphic organisers like Venn diagrams or flowcharts to map out lesson content. When introducing new concepts, they should present a simple image alongside their spoken words to support dual coding. It is also effective to have students create their own mind maps or timelines during revision sessions to help them organise their thoughts. This practice ensures that the visual elements serve a specific cognitive purpose rather than just being decorative.
Visual strategies support learners with dyslexia, autism, or ADHD. They reduce cognitive load by showing, not telling. Learners recognise patterns when abstract ideas become concrete (Carnine, 1992). This approach supports inclusion so all learners access the curriculum (Rose & Meyer, 2002).
Paivio's dual coding theory shows brains process words and visuals separately. Using both channels improves recall and understanding greatly. Yet, Pashler's research suggests avoiding "learning styles". Teachers should use visuals because they aid all learners (Pashler).
Avoid irrelevant details, which distract learners and cause cognitive overload. Do not use "decorative" images lacking a direct link to learning objectives. Always explain how images connect to text for effectiveness (Mayer, 2009).
Concept maps and retrieval grids help learners organise and recall information actively. Timelines benefit history lessons, assisting learners with chronology and cause and effect. These tools, used by Karpicke and Blunt (2011), encourage structured retrieval practice. This approach strengthens the learners' long-term memory, as per Roediger and Butler (2011).
(e.g., Mayer, 2014; Paivio, 1991). Visual methods help learners grasp difficult ideas quickly. Teachers can use visual tools to create interesting lessons. Visual teaching supports different learner preferences (Clark & Lyons, 2011).
Open a free account and help organise learners' thinking with evidence-based graphic organisers. Reduce cognitive load and guide schema building dynamically.
Research shows visual learning improves memory and understanding. Combining visuals with words helps learners reach their cognitive potential (Paivio, 1971). Teachers can make lessons more impactful with considered visual presentation (Levie & Lentz, 1982).
Visual, kinaesthetic, and multi-sensory resources are available. Download the free pack for classrooms and staff rooms. It contains printable posters, desk cards and CPD materials.