Updated on
October 7, 2026
Fishbone Diagram: A Teacher's Guide to Root-Cause Thinking
A fishbone diagram helps pupils organise causes, test explanations and plan stronger arguments. Use the classroom steps, examples and adaptable scaffolds.


Updated on
October 7, 2026
A fishbone diagram helps pupils organise causes, test explanations and plan stronger arguments. Use the classroom steps, examples and adaptable scaffolds.
A fishbone diagram is a visual tool for finding the root causes of a problem. You will also hear it called an Ishikawa diagram, after its creator Kaoru Ishikawa, or a cause and effect diagram. All three names describe the same thing. It is the best known tool for root cause analysis: the discipline of tracing a problem back to what actually drives it, rather than stopping at surface symptoms.
The anatomy is simple. The problem statement sits in a box at the head of the fish. A straight spine runs across the page. Diagonal ribs branch off the spine, one for each category of cause. Specific causes then branch off the ribs as smaller bones. The finished shape looks like a fish skeleton, which gives the tool its name.
The classic version uses cause categories drawn from manufacturing: People, Process (or Methods), Materials, Equipment (or Machines), and Environment. Ishikawa built the diagram for quality control in Japanese industry (Ishikawa, 1976), and its purpose has never changed. It structures a brainstorm so a group digs past the obvious and reaches the causes underneath.
That purpose translates directly into teaching. Ask a class why the Roman Empire fell and you get a list. Ask them to build a fishbone diagram and you get an argument: causes sorted into categories, weighed against each other, and traced back to their roots. This guide covers how to run the tool well, where it sits among other visual organisers, and where it falls short.

Kaoru Ishikawa was an engineering professor at the University of Tokyo and a central figure in Japan's post-war quality movement. He promoted the diagram as a tool that ordinary workers, not just managers, could use to analyse defects on the production line. His short handbook spread the method worldwide (Ishikawa, 1976). The American Society for Quality (ASQ) now lists the fishbone among its seven basic quality tools, and improvement teams in healthcare, aviation and software still reach for it when something goes wrong.
Why did teachers borrow a factory tool? Because the underlying thinking move is one we teach every week. History asks why wars break out. Science asks why a reaction failed. English asks why a character makes a fatal choice. Pastoral conversations ask why a lunchtime keeps going wrong. Each question is multi-causal, and each rewards a learner who can separate types of cause and judge their weight. That is critical thinking given a concrete shape.
The diagram sits naturally in the wider family of thinking frameworks teachers use to make reasoning visible. Its job is narrow: one problem, many causes, sorted and judged. That narrowness is a strength, because learners always know what the diagram is for.
Working memory is small. When solving unfamiliar problems, we hold only a few items in mind at once, and the act of problem solving consumes much of that capacity (Sweller, 1988). A question like "why did the First World War break out?" involves a dozen interacting causes. Asked to juggle them mentally, most learners drop the lot. The fishbone moves the juggling onto paper. Every cause has a fixed place, so working memory is freed for the real work: comparing, connecting and judging. Our guide to cognitive load theory sets out the fuller picture.
Second, the diagram is a non-linguistic representation. Learners who turn text into a structured image process the ideas twice, once in words and once visually, and holding knowledge in both forms supports memory (Paivio, 1986). Classroom research points the same way: creating non-linguistic representations is among the highest-impact strategies available to teachers (Marzano et al., 2001), and visual mapping approaches show above-average effects on achievement (Hattie, 2009).
Third, building the diagram is generative. Learners cannot copy a fishbone out of a textbook. They must select causes, sort them into categories, and decide what connects to what. Mapping and organising are core generative learning strategies, and they deepen understanding in a way re-reading never does (Fiorella & Mayer, 2016). The thinking happens in the sorting.
Finally, the tool raises the ceiling on classroom talk. Recalling one cause is Level 1 work on Webb's Depth of Knowledge. Weighing categories of cause against each other, and defending that judgement, is Level 3. The fishbone gets a whole class operating there because the structure holds the evidence still while learners argue about it. It works best when learners bring prior knowledge to the task, which is why it pairs well with Ausubel's ideas about meaningful learning: the diagram gives new information a structure to attach to.
Step 1: Write a sharp problem statement in the head. Vague heads produce vague diagrams. "The Cold War" is a topic, not a problem. "Why had the wartime alliance collapsed by 1949?" gives learners something to analyse. Phrase it as a question or a specific outcome, and write it in the head box before anything else.
Step 2: Draw the spine and choose the category ribs. For a class new to the tool, provide the categories yourself. Generating good analytical categories is expert work, and asking novices to do it overloads them before the analysis begins. Three or four ribs suit younger learners; up to six suit examination classes. In history you might use political, economic, social and military. In science you might adapt the classic manufacturing set.
Step 3: Brainstorm the bones. Model the first one under a visualiser. Read a short source, find a cause, and think aloud as you decide which rib it belongs to. Then hand over. Learners work through their resources, plotting each cause on the correct rib. Sticky notes work well here, because causes can be moved when a first guess turns out wrong.
Step 4: Dig for the roots. This step separates a fishbone from a tidy list. For each bone, ask "and why does that happen?" and record the answer as a smaller bone branching off it. One or two rounds of why is usually enough at school level. A learner who wrote "Germany feared encirclement" now has to explain what fed that fear, and the analysis deepens visibly on the page.
Step 5: Evaluate. A completed diagram is a planning document, not a finished product. Set a judgement task that forces learners to use it: highlight the rib that mattered most and justify the choice, or rank the ribs and draft the opening paragraph of the essay. The diagram organises the evidence; the evaluation is the learning.

Primary science, Year 3. The head reads "Why did our bean plant die?" Three ribs are pre-drawn and labelled Water, Light and Temperature. The teacher spreads picture cards on the carpet: a watering can, a dark cupboard, a cold windowsill. Learners place each card on the rib where it belongs and explain the choice aloud. Causal reasoning starts here, years before anyone writes an analytical paragraph.
Secondary history, Key Stage 4. The head reads "The outbreak of the First World War". Four ribs carry the familiar MAIN categories: Militarism, Alliances, Imperialism and Nationalism. Working from a source pack, learners plot the Anglo-German naval race on the Militarism rib and the Sarajevo assassination as a bone off Nationalism. When they write the essay later that week, each rib becomes a paragraph and the bones become the supporting detail.
English, GCSE. Planning an essay on Macbeth, the head reads "Macbeth's downfall". The ribs name the forces at work: Lady Macbeth's influence, the witches' prophecies, Macbeth's own ambition, and the politics of loyalty in the play. Learners attach short quotations to each rib as bones. The finished fish is an essay plan in disguise: topic sentences on the ribs, embedded evidence on the bones.
Reflection and behaviour. After a mock examination, the head reads "Where I lost marks on Paper 1" and the ribs offer candidate causes: subject knowledge, timing, question interpretation, revision method. Each learner completes a personal fish from their marked paper, then sets one target for the heaviest rib. Tutors use the same structure for behaviour conversations. "Why do wet lunchtimes keep going wrong?" invites causes without starting from blame.
Most fishbone templates online are built for business meetings. Classroom versions need different design choices.
The full classic. Six ribs with sub-bones. Suited to sixth form and confident Key Stage 4 classes analysing genuinely complex problems.
The three-rib fish. For younger learners, fewer ribs mean clearer thinking. A big head box, three fat ribs, and room to draw as well as write.
Pre-filled scaffolds for SEND. Print the head and rib labels in advance so no learner faces a blank page. Colour-code each rib and supply a matching word bank: causes printed on blue cards belong on the blue rib. The learner still makes the categorisation decision, which is where the thinking lives, but the transcription burden disappears.
The formative assessment version. Head and ribs labelled, bones blank. Learners complete it from memory at the end of a topic. Empty ribs across a class show you exactly what to re-teach.
Whatever the variation, print on A3 in landscape. The fishbone is a wide diagram, and on A4 portrait the bones become cramped scribbles. A carpet-sized version suits whole-class primary work, and digital whiteboards handle the sticky-note stage well. You will find printable versions, alongside the rest of our collection, in our guide to graphic organiser templates.
Choosing the right organiser matters more than owning lots of them.
Mind maps serve divergent thinking. Ideas radiate outwards in any direction, which is ideal for generating possibilities at the start of a unit. A fishbone is the opposite: convergent, disciplined, aimed at one outcome. Use mind maps to open thinking up and a fishbone to close in on an explanation.
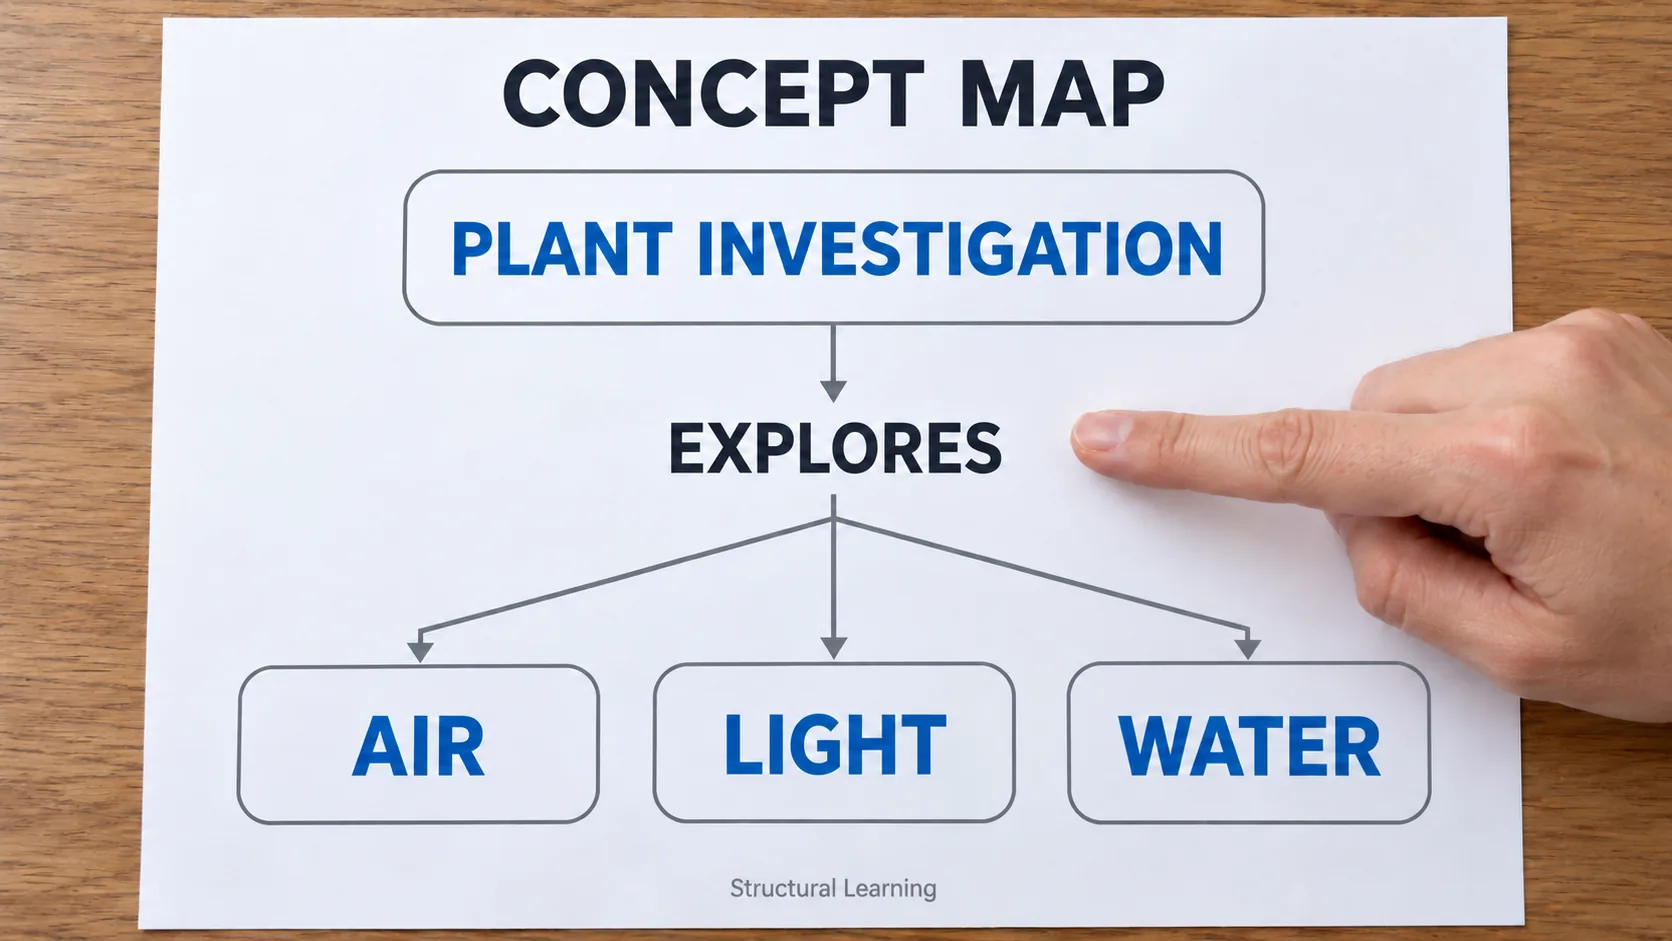
Concept maps show labelled relationships between many ideas across a whole domain (Novak, 1990). They answer "how does everything connect?" A fishbone answers a narrower question: "what caused this one thing?" If the task has no single problem at its centre, a concept map is the better tool.
Knowledge organisers store the facts a class needs to retrieve. They are reference documents, not thinking tools. A productive pairing is to retrieve from the knowledge organisers first, then use the fishbone to do something analytical with what came back.
Timelines handle chronology. A fishbone has no time axis, so when the order of events carries the meaning, the timeline wins. Many history departments use both: timeline first for the story, fishbone second for the causation essay.
The fishbone deserves honest handling, because it has real weaknesses.
It can imply a single neat root. The phrase "root cause" suggests every problem has one buried answer waiting to be dug up. Complex events rarely work that way. Researchers studying root cause analysis in healthcare argue that hunting for single root causes oversimplifies how failures actually happen in complex systems (Card, 2017). Teach learners to expect interacting causes, and to treat any diagram that ends in one triumphant answer with suspicion.
Categories can constrain thinking. Once the ribs are labelled, causes that fit no rib tend to get discarded rather than discussed. The labels quietly do some of the class's thinking for them. Leave one rib deliberately blank, or invite learners to challenge the categories, and the problem eases.
It flattens sequence. The diagram has no time dimension. A chain of events where order matters, such as the escalation of July 1914, loses its shape when spread across static ribs. Pair the fishbone with a timeline when chronology carries the argument.
Whole-class brainstorms invite groupthink. Groups under social pressure converge early on a shared view and stop testing alternatives (Janis, 1972). If the first confident voice frames the problem, the whole fish grows around that framing. A simple fix: learners draft bones silently and alone for three minutes, then the group compares and debates before anything goes on the shared diagram.
The diagram can become the task. Neat lines and coloured ribs are not learning. If the lesson ends when the fish looks finished, the highest-value step never happens. Always follow construction with evaluation.
Start with the primary source: Ishikawa's own handbook (Ishikawa, 1976) is short, practical and surprisingly readable. For the learning science, Sweller (1988) explains why external structure protects working memory, Paivio (1986) grounds the case for visual representation, and Fiorella and Mayer (2016) place mapping among the generative strategies that deepen understanding. Marzano et al. (2001) and Hattie (2009) summarise the classroom evidence for non-linguistic representation and visual mapping. Novak (1990) is the key reference on concept mapping if you want to compare tools. Card (2017) is the sharpest critical read on root cause analysis, and it will keep your use of the fishbone suitably humble.
Card, A. J. (2017). The problem with '5 whys'. BMJ Quality & Safety, 26(8), 671-677.
Fiorella, L., & Mayer, R. E. (2016). Eight ways to promote generative learning. Educational Psychology Review, 28(4), 717-741.
Hattie, J. (2009). Visible learning: A synthesis of over 800 meta-analyses relating to achievement. Routledge.
Ishikawa, K. (1976). Guide to quality control. Asian Productivity Organization.
Janis, I. L. (1972). Victims of groupthink: A psychological study of foreign-policy decisions and fiascoes. Houghton Mifflin.
Marzano, R. J., Pickering, D. J., & Pollock, J. E. (2001). Classroom instruction that works. ASCD.
Novak, J. D. (1990). Concept mapping: A useful tool for science education. Journal of Research in Science Teaching, 27(10), 937-949.
Paivio, A. (1986). Mental representations: A dual coding approach. Oxford University Press.
Sweller, J. (1988). Cognitive load during problem solving: Effects on learning. Cognitive Science, 12(2), 257-285.