Updated on
July 2, 2026
What Is MTSS? The 3 Tiers of Support Explained
What is MTSS, the multi-tiered system of support? A clear definition, the three tiers explained, and how RTI fits into the framework for schools.


Updated on
July 2, 2026
What is MTSS, the multi-tiered system of support? A clear definition, the three tiers explained, and how RTI fits into the framework for schools.
A fifth-grade learner in your class is struggling with reading. You have tried small-group instruction, extra practice with decodable texts, and a seating change to reduce distractions. Progress is still slow, and the learner reads 15 words per minute below the benchmark. The gap is widening.
You know something more structured is needed, but what exactly, and who decides? This is the question that Multi-Tiered System of Supports (MTSS) answers. For more on this topic, see Mtss vs rti. MTSS gives schools a decision-making framework for matching learners to the right level of support based on data, not gut feeling.
It replaces the old model of waiting for learners to fail before acting.
Definition: MTSS, or Multi-Tiered System of Supports, is a school-wide framework for matching learners to the right level of help. It uses universal screening, tiered instruction, targeted interventions, progress monitoring and fidelity checks. These steps help schools provide increasing academic, behavioural and social emotional support (Fuchs & Fuchs, 2006).
MTSS gives learners varied help depending on how they respond to teaching. The National centre on RTI calls it prevention using tiered, proven methods. More information can be found on Response to Intervention RTI. ESSA (2015) names MTSS as a way to allocate resources, improving learner success.
MTSS is not a bought programme or a curriculum. It is a decision structure for identifying which learners need support, what kind of support they need, and when adults should change course. In a strong MTSS framework, schools use screening data to identify risk, progress monitoring data to judge whether interventions and supports are working, and diagnostic assessment to understand why a learner is struggling.
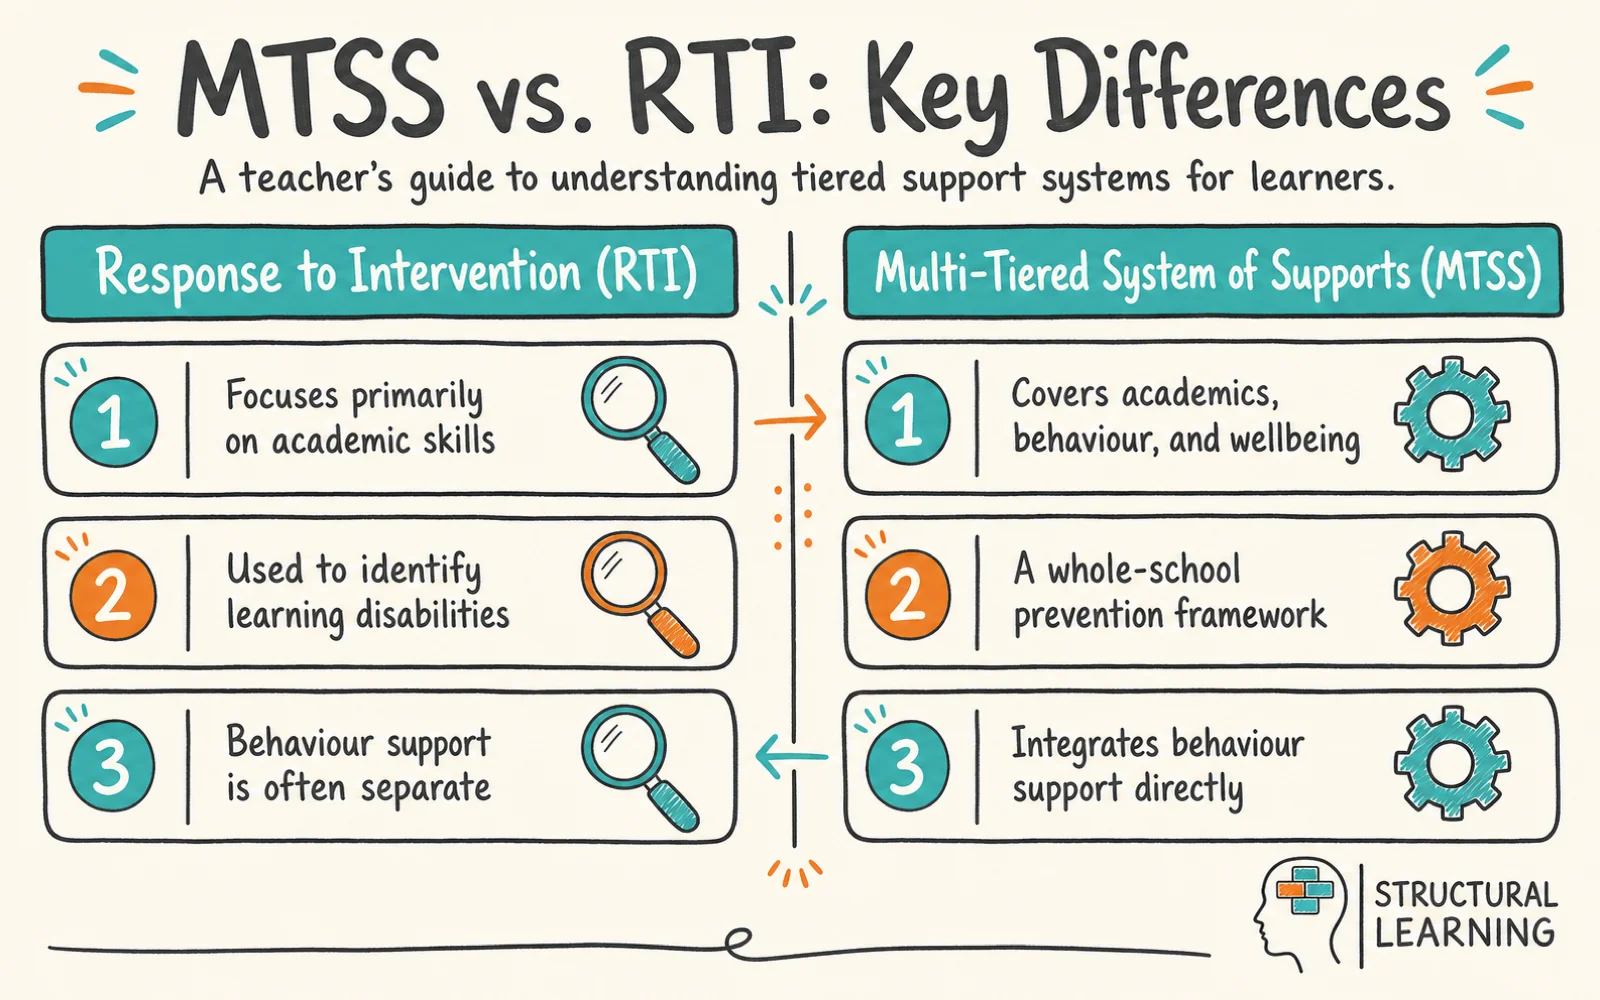
MTSS supports both learning and behaviour. Earlier Response to Intervention models focused mainly on reading and maths (Fuchs & Fuchs, 2006).
MTSS also includes PBIS, social-emotional learning and attendance support. A learner with poor attendance may receive Tier 2 support despite academic success (Crone et al., 2010). Learners who read well but struggle with organisation need self-regulation help (Sugai & Horner, 2006).
The main risk in implementation is a evidence-based delusion. Schools can collect screening scores, graphs and tier paperwork, but still miss how a learner thinks, feels anxiety, attends school or uses language. Selwyn (2015) warns that education data can narrow professional judgement when it becomes a compliance tool. MTSS works best when data sharpens teacher judgement rather than replacing it.
IDEA reauthorised Response to Intervention in 2004. Schools once used IQ discrepancy to find learning disabilities. Use it as a starting point for professional discussion: identify the learner's current need, record evidence from more than one lesson, and agree the next classroom adjustment with the SENCO or family.
A learner had to show a gap between IQ and performance. Fletcher et al. (2007) criticised this "wait to fail" approach because support arrived too late.
Researchers argued Response to Intervention (RTI) offered a new way. Schools screened all learners, providing instruction based on evidence (Al Otaiba, 2022). RTI identified learning difficulties by how learners responded to intervention (Fuchs & Fuchs, 2006; Vaughn, 2003). Those not responding to Tier 1 and 2 help likely had a learning difficulty.
MTSS builds on RTI, adding behaviour and social-emotional help. MTSS emphasises one joined-up system, unlike separate tracks (Sailor, 2009). The framework is school-wide prevention, not just special needs identification (Sugai & Horner, 2009). Many UK schools use MTSS, with RTI as the academic part (Batsche et al., 2005).
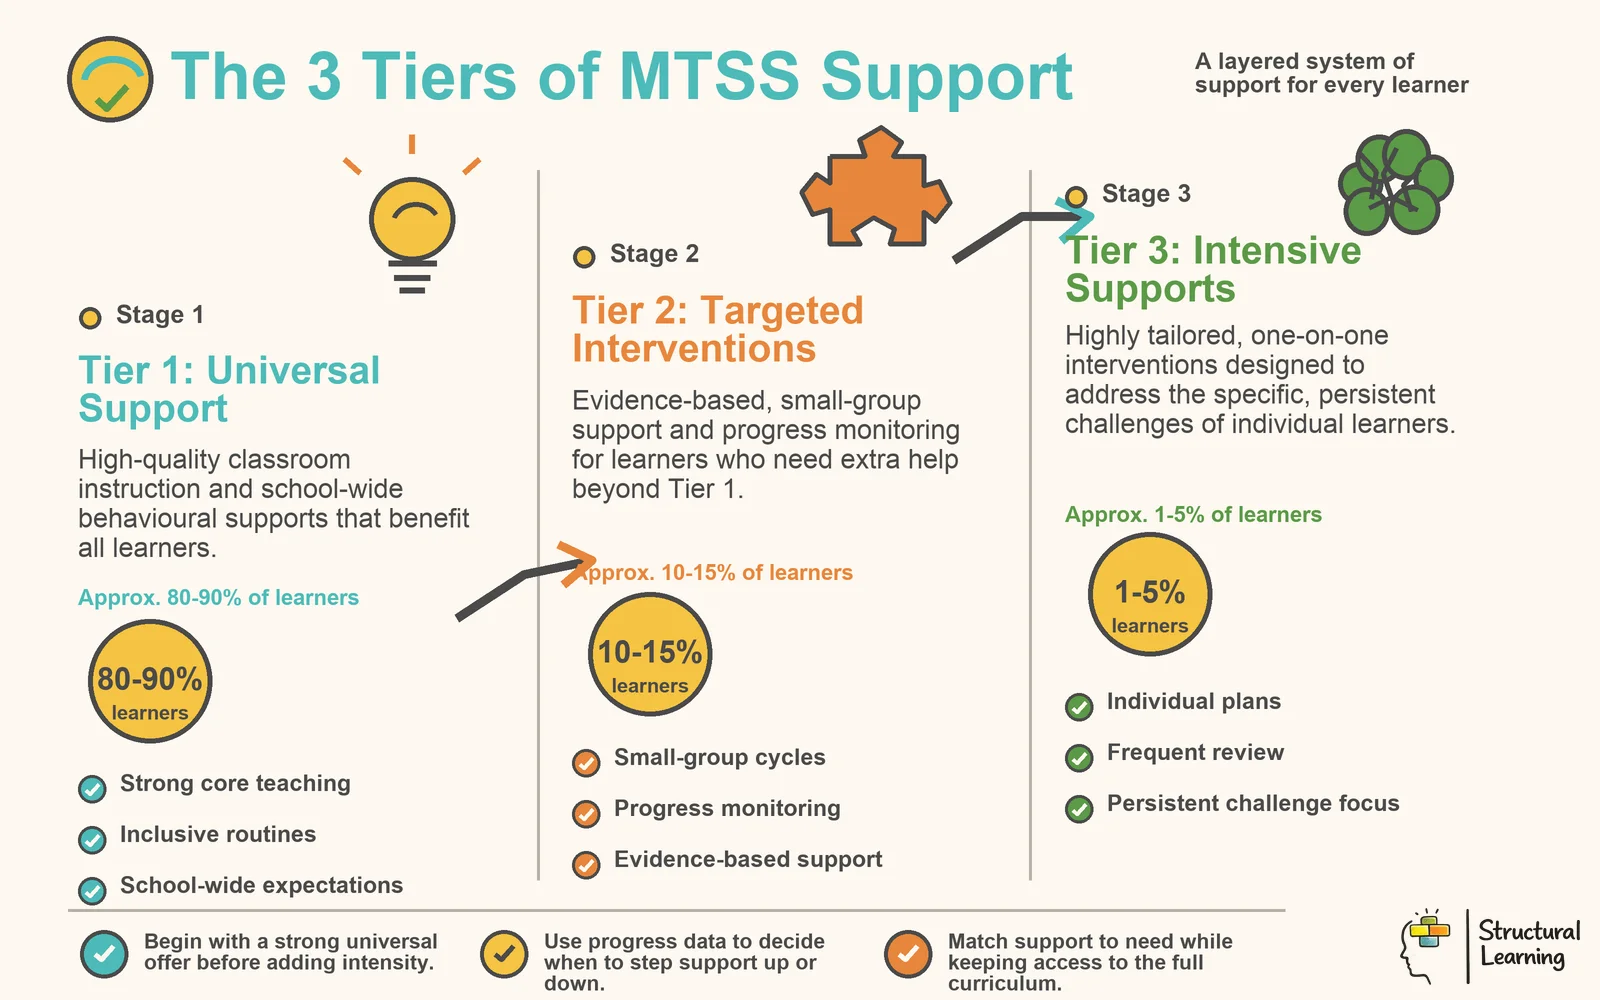
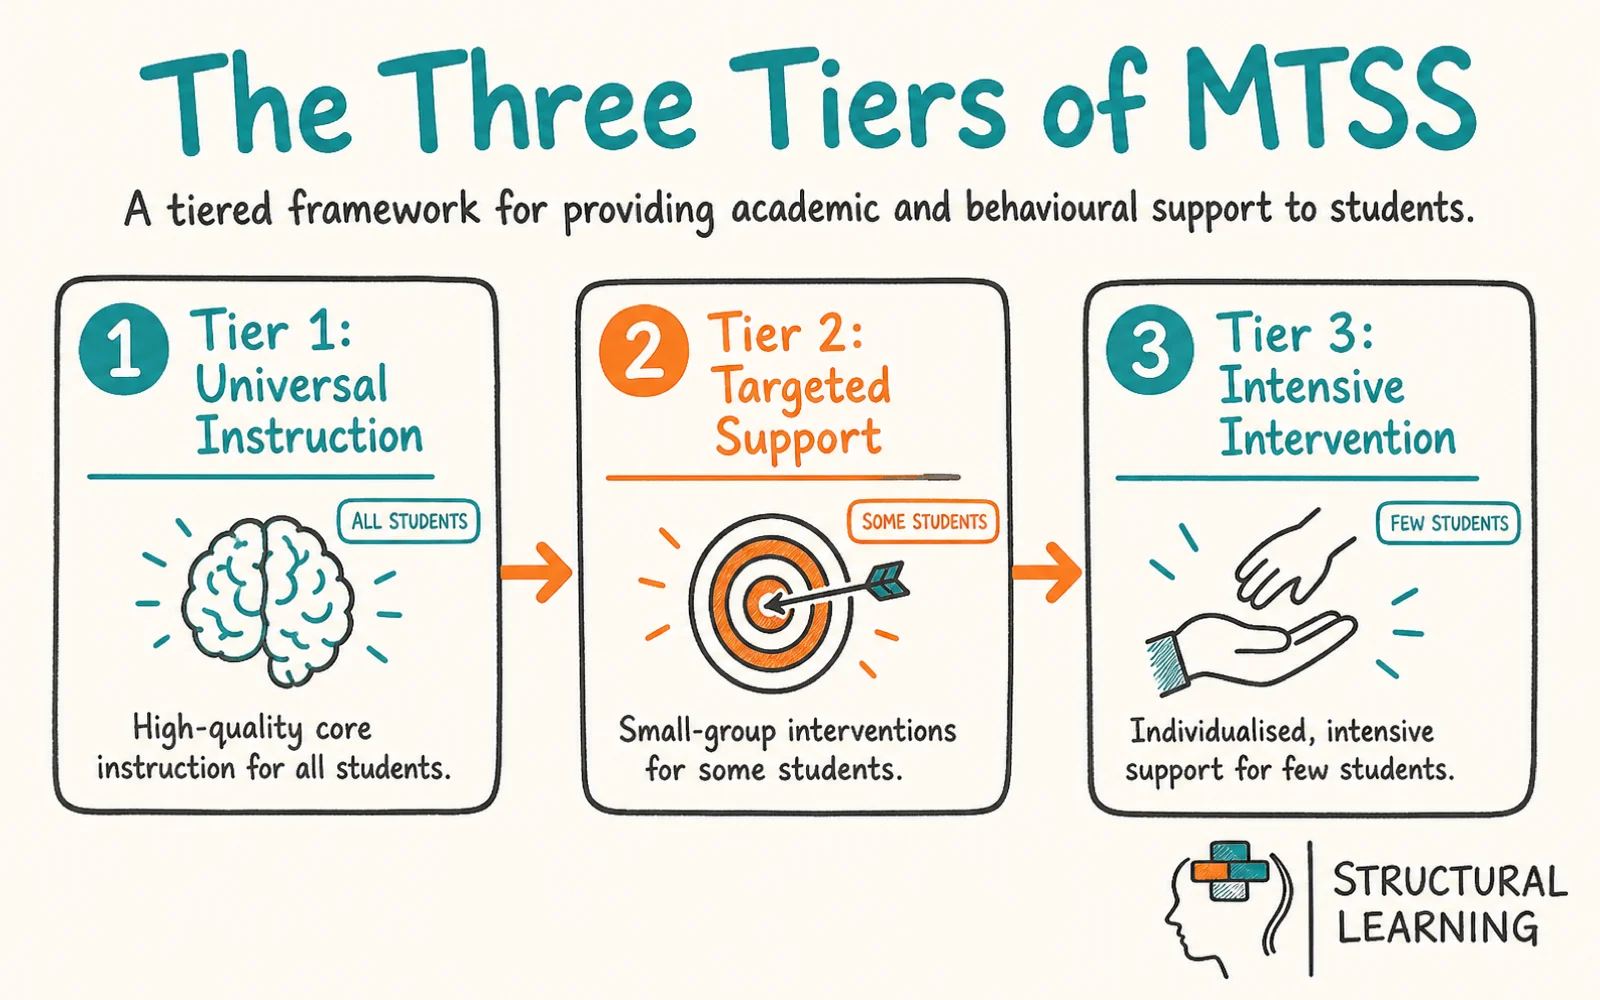
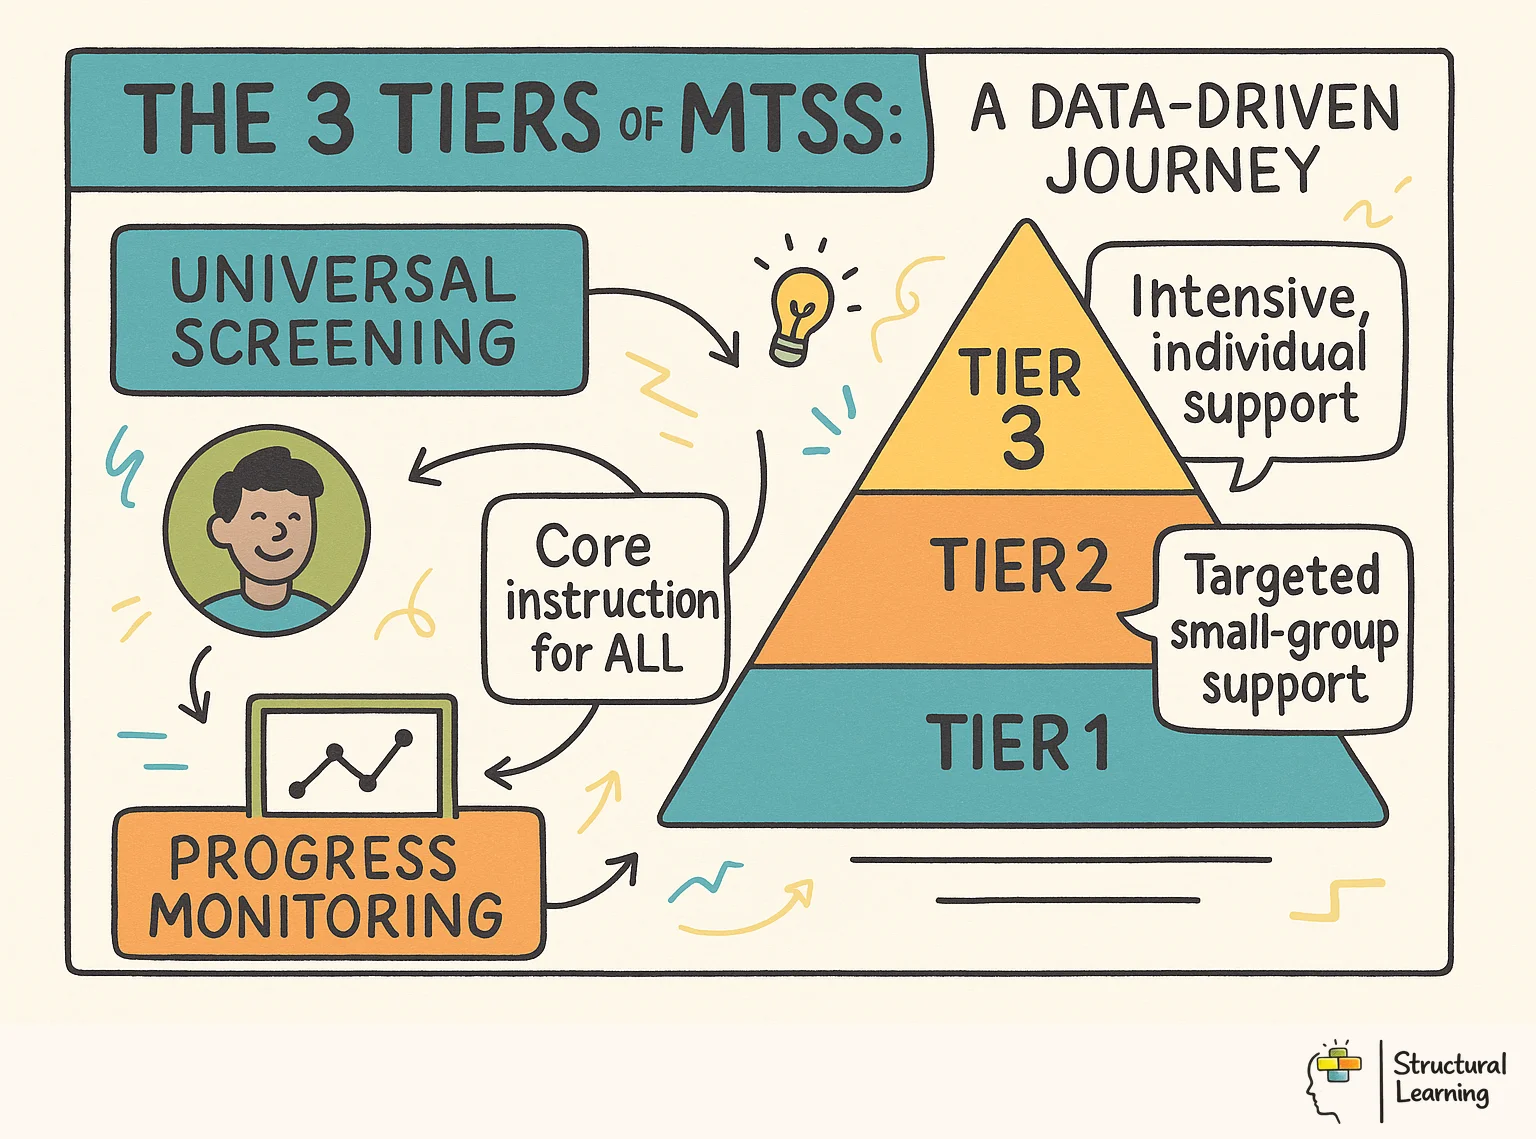
The tiered model is the structural core of MTSS. Each tier represents a level of instructional intensity. Learners move between tiers based on data, not opinion. The percentages below are approximations; they describe what a well-functioning system looks like, not rigid quotas.
Tier 1 is the classroom. Teachers provide learners with good core teaching, using evidence. Tier 1 teaching is expected to meet the needs of approximately 80% of learners in a well-functioning school (Batsche et al., 2005; National centre on Response to Intervention, 2010).
Universal screening happens three times a year: autumn, winter, and spring. These quick tests show which learners are below expected levels.
If under 80% meet benchmarks, core teaching likely needs improvement. This distinction is key.
Differentiation matters most in Tier 1. Group learners flexibly, vary text levels, use graphic organisers, and teach skills explicitly.
A concrete example: a Year 4 teacher uses a structured literacy programme for the whole class. Phonics instruction is explicit and systematic, and learners practise decoding with connected texts each day.
In September, the teacher screens the class using DIBELS and identifies six learners reading below the 25th percentile. Those learners are monitored more closely and may move to Tier 2 if they do not respond to differentiated Tier 1 instruction over the next few weeks.
Tier 2 provides small group instruction in addition to Tier 1. It is not a replacement for core instruction. Learners continue to receive Tier 1 teaching and get supplemental intervention support on top of it. Groups are small, typically three to five learners, and the intervention follows a standardised, evidence-based protocol.
Progress monitoring happens every one to two weeks. Interventions usually last 8 to 12 weeks, and then the team checks learner progress. Tier 2 interventions focus on specific skill gaps found through assessments. They are not general tutoring sessions (Burns & Gibbons, 2008).
A concrete example: a Year 5 learner scores below benchmark on the winter reading fluency screening. She reads 62 words per minute; the benchmark is 90. The MTSS team places her in a Tier 2 group of four learners.
Three times per week, for 30 minutes, a trained interventionist leads repeated reading practice. They use passages with controlled difficulty. Her oral reading fluency is measured every two weeks using curriculum-based measurement probes. After eight weeks, the team reviews the progress graph and decides whether to continue, adapt or intensify support.
Tier 3 is the most intensive level of support. Learners receive one-on-one or very small group instruction (two to three learners) at higher frequency and longer duration than Tier 2. Instruction is more explicit, more scaffolded, and often delivered by a specialist. Progress monitoring happens weekly.
If a learner still struggles after 8-12 weeks of Tier 3 intervention, consider a special education assessment. The Tier 3 data can then support that assessment process (Batsche et al., 2005).
A concrete example: A second-grade learner has received Tier 2 reading intervention for 10 weeks with minimal progress. He still confuses b/d, struggles to blend CVC words, and reads 18 words per minute. The MTSS team moves him to Tier 3. He now receives daily one-on-one Orton-Gillingham instruction with a reading specialist for 45 minutes.
His working memory and phonological processing are assessed to better understand the underlying difficulty. Weekly progress monitoring tracks letter-sound fluency and word reading accuracy.
Universal screening is the starting point for every MTSS decision. These short, standardised assessments are usually given to all learners three times per year: autumn, winter and spring. They help schools identify learners who may be at risk of academic, behavioural or social emotional difficulty before the gap widens.
Common screening tools include DIBELS (Active Indicators of Basic Early Literacy Skills), AIMSweb, MAP Growth, iReady, and Star Assessments. Each tool provides benchmark scores that indicate whether a learner is on track, at some risk, or at high risk. A typical cut point is the 25th percentile: learners scoring below this threshold are flagged for additional monitoring or Tier 2 support.
Screening is not diagnosis. If a learner scores below benchmark in autumn, the school has identified them as potentially at risk.
The screening does not explain why the learner is struggling. It also does not identify a learning disability.
| Feature | RTI | MTSS |
|---|---|---|
| Primary focus | Academics (reading, math) | Academics, behaviour, social-emotional, attendance |
| Origin | IDEA 2004 (LD identification) | ESSA 2015 (whole-school prevention) |
| behavioural support | Separate from RTI (PBIS ran in parallel) | Integrated within the same tiered system |
| Primary purpose | Identify learners who may have a learning disability | Prevent academic and behavioural failure for all learners |
| Data use | Screening and progress monitoring for academics | Screening, progress monitoring, and diagnostic data across all domains |
| Relationship | Standalone framework | RTI is a component within MTSS |
It raises a flag for closer observation. The next step is progress monitoring, not labelling.
A practical example: a school screens all Reception learners in September using DIBELS Next. The letter naming fluency subtest shows that 22 out of 25 learners can name at least 40 letters per minute. Three learners name fewer than 20.
Those three learners are not immediately placed in Tier 2. The teacher first provides targeted letter-name practice within Tier 1, using small group rotations during the literacy block, and monitors progress weekly for four weeks. Two learners reach benchmark. One does not, so that learner moves to Tier 2.
Screening learners early avoids problems. Learners get support before catching up is too hard. Screening also reduces over-identification. Teachers' judgement alone is less accurate than tests, says Gersten et al., (2009).
CBM helps measure learners' progress. After Tier 2 or 3 starts, progress monitoring becomes key data. Progress monitoring uses short, standard measures to track improvement over time (Deno, 1985; Fuchs & Deno, 1991).
The process works like this. The interventionist administers a one-minute reading probe (or a brief math computation probe) every one to two weeks. Each data point is plotted on a graph. The graph also includes an aimline: a straight line from the learner's starting performance to the year-end goal, showing the rate of growth needed to reach benchmark by spring.
Use the three-data-point rule to guide decisions. If three data points are below the line, change the support (Johnston & Street, 2004). You might try a different method, more frequent sessions, or smaller groups. Also check that you are implementing the support as planned (Glover & Dibble, 2008).
If three data points are above the line, the learner is responding well. They might need less support (Burns & Gibbons, 2008).
| Feature | Tier 1 | Tier 2 | Tier 3 |
|---|---|---|---|
| Learners served | All learners (~80% meet benchmarks) | ~15% of learners | ~5% of learners |
| Group size | Whole class | Small group (3-5 learners) | Individual or very small group (1-3 learners) |
| Instruction type | Evidence-based core instruction with differentiation | standardised intervention protocol targeting specific skill deficit | individualised, intensive, explicit instruction |
| Progress monitoring | Universal screening 3x per year | Every 1-2 weeks | Weekly |
| Duration before review | Ongoing | 8-12 weeks | 8-12 weeks |
| Delivered by | Classroom teacher | Trained interventionist or teacher | Specialist (reading specialist, school psychologist) |
| Example | Explicit phonics instruction for all learners | Small-group repeated reading 3x per week for 30 min | Daily 1:1 Orton-Gillingham tutoring for 45 min |
Here is a practical example. Marcus, a Year 4 learner, reads 45 words per minute in October. His spring benchmark goal is 90 words per minute. Over 28 weeks, his aimline requires a gain of roughly 1.6 words per minute per week.
After six weeks of Tier 2 intervention, Marcus has gained only 0.5 words per minute per week. His three most recent data points are 47, 48 and 48, all below the aimline. The MTSS team increases intervention frequency from three to five sessions per week and adds a phonics component alongside fluency practice.
Rate of improvement (ROI) makes progress monitoring usable. Calculate it by subtracting the baseline score from the most recent score and dividing by the number of weeks. Then compare the learner's ROI with the expected rate for peers.
If peers are growing at 1.5 words per minute per week and the learner is growing at 0.5, the gap is widening. If the learner is growing at 2.0, the gap is closing. This is the kind of data that formative assessment supports: frequent, low-stakes measurement that informs the next instructional decision.
Schools move learners between tiers because the data shows a need, not because it is easier to manage. Each transition has clear criteria. Use it as a starting point for professional discussion: identify the learner's current need, record evidence from more than one lesson, and agree the next classroom adjustment with the SENCO or family.
Tier 1 to Tier 2. A learner scores below benchmark on universal screening and does not respond to differentiated instruction within Tier 1 over a reasonable period (typically four to six weeks of targeted support within the classroom). The classroom teacher documents what was tried and the learner's response. The MTSS team reviews the data and places the learner in a Tier 2 intervention group.
Tier 2 to Tier 3. A learner has had 8 to 12 weeks of Tier 2 intervention delivered with fidelity. Progress monitoring data shows inadequate growth.
Inadequate growth means the learner's rate of improvement is not on track to close the gap with grade-level peers. The team checks whether the intervention was appropriate and delivered as designed.
They also consider whether diagnostic assessment is needed to better understand the learner's specific difficulties. If the answers point toward more intensive support, the learner moves to Tier 3.
Some learners make insufficient progress after 8-12 weeks of Tier 3 help. The team records the interventions, fidelity data and progress monitoring (Burns & Gibbons, 2008). This evidence becomes part of the special education referral (Burns & VanDerHeyden, 2006).
Before increasing support, ensure interventions are delivered properly. Check if the current plan was implemented as intended (Gresham et al., 1993). A learner getting two sessions instead of four hasn't had Tier 2 support. Verifying this avoids wrongly increasing support levels.
MTSS data can inform, but never replace, a full special education evaluation. IDEA 2004 is a United States law, not UK legislation. In US schools, RTI and MTSS data may form part of the evidence base for identifying specific learning disabilities. In UK schools, the closer parallel is the Graduated Approach under the SEND Code of Practice, where assessment, provision and review evidence inform SEN Support and, where needed, EHCP decisions.
A critical legal point: a parent can request a special education evaluation at any time. The school cannot use MTSS as a reason to delay or deny evaluation. If a parent submits a written request for evaluation, the school has 60 days (or the timeline specified by state law) to complete the evaluation, regardless of where the learner sits in the MTSS framework. The Office of Special Education Programs (OSEP) has clarified this repeatedly. MTSS is a general education framework for all learners; it does not gatekeep access to special education.
Learners who already have an individualised Education Program (IEP) still participate in MTSS. Their IEP is, in effect, their Tier 3 plan. The specially designed instruction outlined in the IEP serves as the learner's intensive intervention. Progress monitoring for IEP goals functions the same way as MTSS progress monitoring: regular data collection, graphed results, and team review.
MTSS paperwork helps learners with dyslexia or ADHD. It shows that schools used research-based support before assessment. The records show which interventions helped learners and which did not. This tells the evaluation team what individualised teaching may be needed.
Readers outside the United States will recognise many MTSS principles under different names. In the UK, the closest framework is the Graduated Approach, outlined in the SEND Code of Practice (2015). The Education Endowment Foundation (2021) describes this as a responsive Assess, Plan, Do, Review cycle: identify need, plan provision, deliver support, and use assessment evidence to decide whether to adapt, intensify or step down support.
| MTSS Tier | UK Equivalent | Who Is Responsible |
|---|---|---|
| Tier 1: Universal instruction | Quality First Teaching (universal provision) | Classroom teacher |
| Tier 2: Targeted interventions | SEN Support (Assess, Plan, Do, Review) | Class teacher + SENCO |
| Tier 3: Intensive, individualised support | EHCP (Education, Health and Care Plan) | Multi-agency team (school, health, social care) |
The tiered structure maps roughly as follows. Tier 1 corresponds to Quality First Teaching: high-quality, differentiated classroom instruction that meets the needs of most learners. Tier 2 maps to SEN Support, where the class teacher and SENCO plan targeted interventions and supports for learners who need additional help. Tier 3 corresponds to an Education, Health and Care Plan (EHCP), the most intensive level of support for learners with significant and complex needs.
US schools formalise tiered support with clear criteria and team decisions. UK schools use APDR more flexibly; the SENCO coordinates support, and teachers deliver it. Both systems aim to identify needs early, use proven interventions, monitor progress, and adapt. UK teachers can use the SEND-friendly environments guide for Tier 1 design. See the Graduated Approach (Assess, Plan, Do, Review) and the SEND guide for details.
MTSS often fails for everyday operational reasons. These include no protected intervention block, limited professional development, weak decision rules and data meetings that become paperwork. Recent implementation reports put daily MTSS fidelity at about 24%. So headteachers should treat timetabling, specialist staffing, family communication and fidelity checks as the supports that make the framework work in practice.
Using MTSS to postpone special education evaluation is a grave error and against IDEA. Schools can't force learners through all MTSS tiers before evaluation. If parents request assessment, schools must act within legal timelines. MTSS data aids evaluation (Jimerson, Burns & VanDerHeyden, 2016; Batsche et al., 2005), but is not required.
Check how Tier 2 intervention is delivered. If delivery is inconsistent, it no longer counts as true Tier 2 support. Before judging how a learner has responded, verify intervention integrity. Use checklists, observation and logs (Gresham et al., 1993; Sanetti & Kratochwill, 2009).
Avoid skipping universal screening. Jenkins et al. (2007) found screening finds at-risk learners better than teachers do. Quiet learners may struggle without notice. Screening identifies learners with hidden planning issues.
Not graphing progress monitoring data. A number on a spreadsheet is not the same as a graph with an aimline. When data points are plotted visually, trends become obvious. A teacher can see at a glance whether the learner's trajectory is pointing toward or away from the goal. Without graphs, teams make decisions based on impressions rather than patterns.
Pulling learners from core instruction for intervention. Tier 2 and Tier 3 interventions are supplemental. They must sit on top of Tier 1 classroom teaching, not replace it. A learner who misses 30 minutes of science every day for a reading group is losing access to the curriculum the intervention is meant to unlock. School leaders need to fund and timetable a protected intervention block, with clear staffing, so learners do not lose core content while receiving targeted interventions.

RTI targets reading and maths (Batsche et al., 2005). MTSS includes RTI but also behaviour and wellbeing. MTSS uses data like RTI, but considers the whole learner. (Sugai & Horner, 2009).
Tier 1 gives all learners quality core instruction (Burns & VanDerHeyden, 2006). Teachers screen all learners to find those at risk and track progress often. Good schools see 80 percent of learners succeed at this level (Buffum et al., 2012).
Tiered support helps schools spot learners who are struggling early. This can prevent academic and behavioural problems from growing. It replaces waiting for failure before giving the right help. Schools use data to match support and use resources well (Kauffman & Landrum, 2018; Sugai & Horner, 2009).
Researchers say MTSS needs committed leaders. The Every Learner Succeeds Act links MTSS to resources. Data interventions boost learner outcomes, better than older methods.
Teachers often move learners up tiers too soon. First, check the intervention was done as planned. If not done correctly, poor results do not mean learners need more support. Ensure correct intervention delivery before moving to a higher tier (Burns & Gibbons, 2008).
If your school is beginning to implement MTSS or you want to strengthen your role within an existing system, these steps provide a practical starting point. Use it as a starting point for professional discussion: identify the learner's current need, record evidence from more than one lesson, and agree the next classroom adjustment with the SENCO or family.
Open a free account and help organise learners' thinking with evidence-based graphic organisers. Reduce cognitive load and guide schema building dynamically.
Next time your MTSS team meets, bring one learner's progress monitoring graph with the aimline drawn. Compare the learner's actual rate of improvement to the expected rate. That single comparison will tell you more about whether the intervention is working than any narrative summary.
Use this free tool to evaluate data for a learner and receive a recommended MTSS tier with action steps. All data stays in your browser. Use it as a starting point for professional discussion: identify the learner's current need, record evidence from more than one lesson, and agree the next classroom adjustment with the SENCO or family.
MTSS is often presented as a clean route from screening to intervention, but the research base is less settled in practice. Burns et al. (2005) found strong effects for response intervention studies, yet Hattie (2009) warned that intervention effects can be inflated when small, positive studies are published and failed replications remain unseen. Schools should treat effect sizes as starting evidence, not as proof that a named programme will work in their setting.
A second critique concerns data. Selwyn (2015) argued that data systems can narrow professional judgement when measurement becomes a proxy for care. In MTSS, this appears when teachers collect graphs, checklists and tier movement forms while missing what the learner says, avoids or understands. Brown (1987) reminds us that self-regulation and metacognitive control are partly internal processes, so they are not fully captured by screening scores.
Equity is the third risk. Ladson-Billings (1995) showed that apparently neutral standards can pathologise cultural, linguistic and class differences when schools do not examine whose knowledge counts. EAL learners and working-class learners may be over-identified for intervention if benchmarks ignore dialect, prior schooling or access to print. AI screeners add a newer version of the same problem: UCL Knowledge Lab (2024) warns that education data systems can reproduce bias unless humans audit training data, thresholds and decisions.
MTSS still has enduring value when used with fidelity, cultural humility and teacher judgement. Its strength is not the tier labels, but the disciplined habit of noticing need early, testing support, and changing provision when learners do not respond.
Brown, A. (1987). Metacognition, executive control, self-regulation, and other more mysterious mechanisms.
Tiered support frameworks use evidence from peer-reviewed papers. Researchers, like Fuchs and Fuchs (2006), support response to intervention. Focus on learners' needs using research by Batsche et al. (2005).
Introduction to the special series: Response-to-Intervention View study ↗
Fuchs, D., & Fuchs, L. S. (2006)
Fuchs and Fuchs (2006) presented RTI as a new way to identify learning difficulties, instead of relying on achievement gaps. They detailed problem-solving and standard protocols that now inform MTSS Tiers 2 and 3. SENCOs and coaches who use tiered support will find it useful.
Response to intervention: Research for practice View study ↗
Burns, M. K., & Symington, T. (2002)
Problem-solving teams cut special education referrals by 60% (Tilly, 2008). Academic results improved with early intervention (Buffum et al., 2012). These findings support the tiered intervention model (National centre on Response to Intervention, 2010).
Response to Intervention (RTI) uses multi-tiered support systems. Use research-backed methods. See the handbook by Jiminez et al. (2016) for practical guidance. Focus on each learner's needs. Effective strategies improve outcomes (Brown-Chidsey & Bickford, 2016).
Jimerson, S. R., Burns, M. K., & VanDerHeyden, A. M. (Eds.) (2016)
MTSS screening to Tier 3 fidelity is explained. Data-based individualisation and progress monitoring rates are detailed. Burns and Gibbons (2008) provide problem-solving team advice for framework design.
A model for the evaluation of an RTI system for students who need Tier 2 and Tier 3 interventions View study ↗
312 citations
VanDerHeyden, A. M., Witt, J. C., & Gilbertson, D. (2007)
VanDerHeyden et al. (2007) evaluated RTI across a district. Tier 2 intervention decreased special education referrals by 38%. Early, accurate learner identification also improved. Their tier movement rules appear in current MTSS guidance.
Consider Response to Intervention (RTI) frameworks carefully. Screen all learners with universal screening. Fuchs and Fuchs (1986) highlight progress monitoring too. Implement evidence based interventions for struggling learners (Kauffman & Hallahan, 2005). Use data to inform your teaching decisions (Batsche et al., 2005).
National centre on Response to Intervention (2010)
The US National centre on RTI (n.d.) details four key RTI parts. These include multi-level prevention, universal screening and progress monitoring. Schools often cite this document when creating MTSS systems. Implementation research uses its fidelity rubrics (n.d.).