Updated on
July 2, 2026
Progress Monitoring (CBM): Steps, Tools & Examples
What is progress monitoring? A clear guide to the steps, the tools (DIBELS, easyCBM, Acadience) and classroom examples for tracking progress over time.


Updated on
July 2, 2026
What is progress monitoring? A clear guide to the steps, the tools (DIBELS, easyCBM, Acadience) and classroom examples for tracking progress over time.
Slug: progress-monitoring-cbm-teachers-guide
---
Progress monitoring is the systematic, repeated measurement of student performance over time to determine whether instruction is working. Curriculum-Based Measurement (CBM) is the most rigorously researched tool for doing this: standardised, brief probes drawn from the curriculum a student is expected to master by year's end. Together, they answer the question every teacher already asks informally: is this child making progress, and if not, what do I change?
Deno (1985) created CBM at Minnesota as a practical measurement for special education. He saw academic ability could be checked in minutes using curriculum probes. This repeated data showed learning better than single tests. Forty years of research confirm this (Deno, 1985).
This guide covers how CBM works, how to read the graphs it produces, and, critically, what to do when the trendline is flat.
---
Consider a Year 3 reading fluency probe. Rather than assessing only the phonics patterns introduced in October, the probe draws from the full range of grade-level text the student will need to read by June. A student who scores low in October and rises steadily over the year is demonstrating genuine learning growth. A student who scores high on unit tests but flat on CBM probes may be mastering taught chunks without building fluency across the broader curriculum.
This is the difference between a skills-mastery approach and a curriculum-sampling approach. Skills mastery measures whether a discrete skill is acquired. Curriculum sampling measures general proficiency in the academic domain. CBM sits in the curriculum-sampling tradition, so it is useful for tracking growth across the wider year, not just performance on the last taught unit.
Standardised probes use fixed instructions, timing and scoring (Deno, 2003). Consistent testing lets teachers track learner progress over time; score changes are more interpretable when they reflect learning rather than varied test methods.
---
IDEA (2004) demands IEPs contain measurable annual goals. It also says parents get regular progress reports. Progress monitoring gives data to meet these IDEA demands. Without measurement, reports to parents are just estimates, not actual evidence. (IDEA, 2004).
Beyond compliance, the evidence for progress monitoring as an instructional tool is substantial. Fuchs and Fuchs (1986) conducted a landmark meta-analysis of 21 studies. They found that teachers who used CBM data to make instructional decisions produced significantly greater student gains than those who relied on professional judgement alone. The effect size was 0.70, which the authors noted was comparable to one-to-one tutoring effects.
The process is straightforward: when you collect data every week, you see problems within weeks. This is better than discovering at year's end that a student did not meet their goal. Stecker, Fuchs, and Fuchs (2005) confirmed this in a review of 18 studies. They concluded that progress monitoring only helps achievement when teachers actually use the data to change instruction. Collecting data without changing practise produces no benefit.
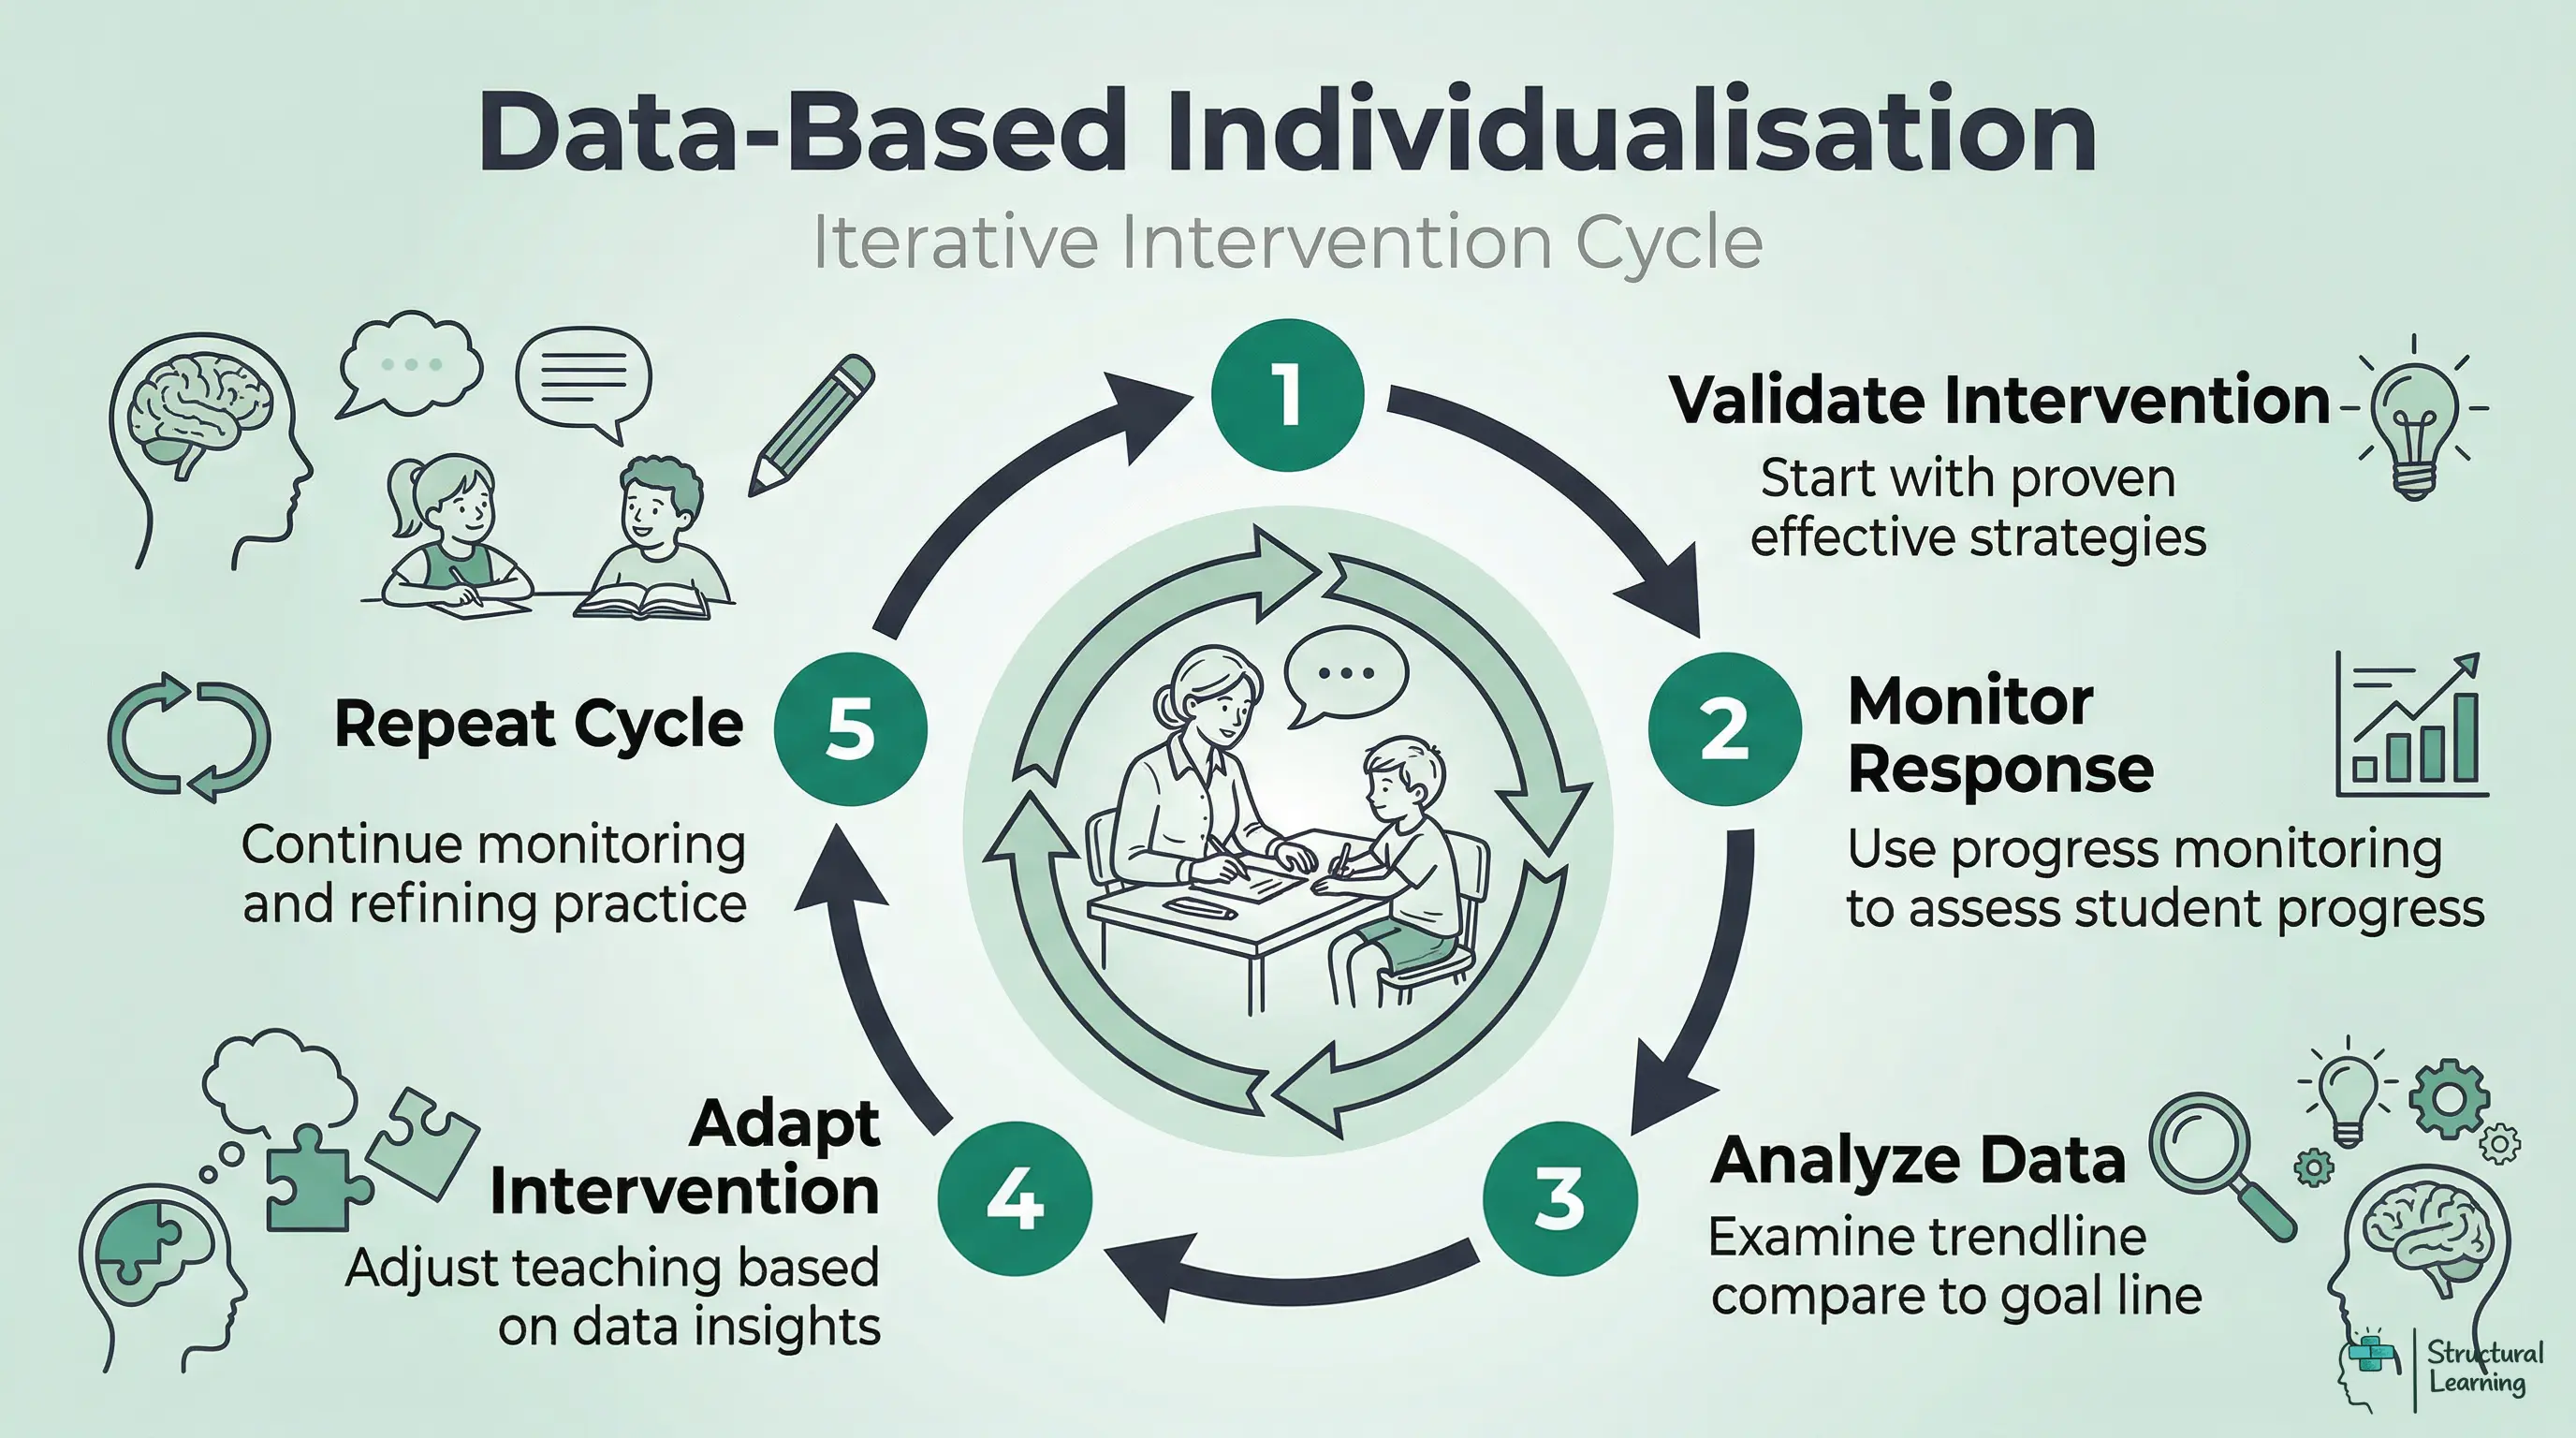
NCII (2013) developed Data-Based Individualisation (DBI). DBI uses five steps to support learners. Use intervention, monitor progress, analyse data, adapt, then repeat. DBI builds on Deno and Fuchs' work. Teachers using MTSS and RTI will find DBI makes support responsive.
---
Progress monitoring tools are domain-specific. The reading probe that works for a first-grader is not the same as the one that works for a fourth-grader, and neither translates to maths or writing. The table below summarises the major CBM tools by domain.
Oral Reading Fluency (ORF) is the most researched CBM measure. The student reads aloud from a grade-level passage for one minute; the examiner records words read correctly per minute (WCPM). WCPM is a strong indicator of overall reading proficiency because fluent reading requires the simultaneous integration of decoding, vocabulary, and comprehension (Good and Kaminski, 2002).
DIBELS (Dynamic Indicators of Basic Early Literacy Skills), AIMSweb and easyCBM are common ORF platforms in US schools. They provide benchmarks, standardised passages and growth norms, but schools should always use the current benchmark table for the specific measure they administer. Hasbrouck and Tindal's oral reading fluency norms are a widely cited reference point; the broad spring ranges below are illustrative rather than a substitute for local or platform-specific norms:
- Grade 1 (spring): 60-90 WCPM
- Grade 2 (spring): 90-110 WCPM
- Grade 3 (spring): 110-130 WCPM
- Grade 4 (spring): 115-140 WCPM
Students reading more than 10 words per minute below benchmark warrant closer monitoring.
Maze passages are a valid alternative for students who find oral reading uncomfortable or for group administration. A passage has every seventh word replaced with three choices; the student selects the correct word silently for two to three minutes. Maze correlates well with reading comprehension and is particularly useful from Grade 3 upwards, where comprehension increasingly separates struggling readers from fluent ones.
ORF scores should be interpreted with error patterns, not as a single number. A learner with weak decoding, a learner with slow but accurate reading, and a learner with vocabulary or comprehension gaps may produce similar WCPM scores but need different intervention responses.
CBM maths probes take two forms: computation probes and concepts and applications probes. Computation probes typically last two minutes and contain a mixed set of problems matching grade-level expectations. Examples include single-digit addition in Grade 1, multi-digit operations in Grades 3 to 5, and fraction computation in Grades 6 to 7. The score is digits correct per minute rather than problems correct, which gives finer-grained measurement.
Some maths progress-monitoring systems also include concepts and applications probes. These use word problems, measurement tasks and data displays to give a wider view of mathematical reasoning. Treat them as one strand of evidence alongside computation fluency and item-level error analysis, not as a standalone diagnosis.
This points to the value of CBM. Applying cognitive load theory helps teachers look beyond the score. Good computation scores but poor mixed-probe performance may suggest that the learner can perform basic operations but struggles when they must select, sequence and apply them in a more complex task (Geary, 2004; Sweller, 1988; Paas et al., 2003).
Written expression CBM is less commonly implemented than reading or maths, but it is a valuable tool for students with writing difficulties. A grade-level sentence starter is provided and the student writes for three minutes. Scores are reported as:
- Total Words Written (TWW): a measure of productivity and fluency
- Correct Writing Sequences (CWS): a measure of adjacent words that are spelled and used acceptably in context. Studies of written-expression CBM have examined CWS, percentage of CWS and related sequence measures as indicators of writing accuracy and classification accuracy (Furey et al., 2016).
CWS is the more sensitive measure for tracking growth in students receiving writing intervention. A student who writes many words but with poor syntax will have a high TWW and a low CWS ratio; intervention targeting sentence structure should raise the CWS score while TWW may stay stable or even decrease initially as the student slows down to apply new skills.
Spelling CBM uses a dictation format: the examiner reads words aloud and students write them. Scoring counts correct letter sequences (CLS) rather than whole words, which makes the measure sensitive to partial learning. A student who writes 'frend' for 'friend' has most of the letter sequences correct and the score reflects that partial knowledge. This matters for tracking progress in students with dyslexia, where growth can be genuine but slow, and whole-word scoring would understate it.
---
| Domain | Tool / Measure | What It Measures | Probe Duration | Typical Frequency | Primary Use |
|---|---|---|---|---|---|
| Reading | DIBELS ORF / AIMSweb ORF / easyCBM | Words correct per minute | 1 minute | Weekly (Tier 3), biweekly (Tier 2), 3x/year (benchmark) | Benchmark and progress monitoring |
| Reading | DIBELS Maze / AIMSweb Maze | Correct maze selections | 2-3 minutes | Biweekly to monthly | Comprehension screening, group admin |
| Maths | AIMSweb M-COMP / easyCBM Maths | Digits correct per minute | 2 minutes | Weekly to biweekly | Computation fluency monitoring |
| Maths | AIMSweb M-CAP | Concepts and applications score | 6-8 minutes | Monthly | Applied reasoning, state test prediction |
| Written Expression | CBM-WE (AIMSweb / local probes) | Total words written; correct word sequences | 3 minutes | Biweekly to monthly | Writing fluency and quality monitoring |
| Spelling | CBM Spelling (dictation format) | Correct letter sequences | 2 minutes | Biweekly | Spelling growth, partial knowledge tracking |
---
The first decision is measure selection. Choose the CBM measure that maps most directly to the student's IEP goal. If the goal targets reading fluency, use an ORF measure. If the goal targets maths computation, use a computation probe. Mismatching the measure to the goal is a common error that renders the data uninterpretable.
Collect a minimum of three data points before setting the goal line. Three points allow you to calculate a median baseline score that is less susceptible to a single bad or good day. Administer probes on three separate days, ideally within a one-week window, and use the median score as your baseline.
Some practitioners prefer a three-point baseline spread over two weeks to capture natural performance variability. For a student whose baseline scores are 42, 67, and 51 WCPM, the median is 51. Starting with a single score of 67 would produce an unrealistically high baseline and a goal that may be beyond reach.
There are two main approaches to goal-setting: using normative growth rates and using end-of-year benchmark targets. Normative growth rates specify expected weekly gains for typical students at each grade level. For oral reading fluency, typical growth rates (from Fuchs, Fuchs, Hamlett, Walz, and Germann, 1993) are approximately:
- Grade 1: 2-3 WCPM per week
- Grade 2: 1.5-2 WCPM per week
- Grade 3: 1-1.5 WCPM per week
- Grade 4: 0.85-1.1 WCPM per week
For students receiving Tier 3 intervention, the NCII (2013) recommends setting growth rate goals that are 1.5 times the typical rate, reflecting the expectation that intensive intervention should accelerate growth. A Year 3 student with a baseline of 60 WCPM and a 30-week intervention period might have a goal of 60 + (1.5 × 1.25 × 30) = 116 WCPM. This approaches the grade-level benchmark.
Setting IEP goals linked to CBM growth rates requires the same careful attention to ambition and reachability described in guidance on writing neurodiversity-affirming IEP goals. Goals should stretch the student meaningfully without being set so high that the data always shows failure.
Graph every data point as it is collected. The visual display of CBM data is not optional or decorative; it is the mechanism by which you and the student can see the learning trajectory. The graph contains:
- The baseline: Three to four data points plotted to the left of a vertical phase change line
- The goal point: A single point plotted at the goal score on the final week of the monitoring period
- The aimline: A straight line connecting the median baseline to the goal point; this is the expected trajectory
- Data points: Each weekly or biweekly probe score plotted and connected
Most CBM platforms (DIBELS Next, AIMSweb Plus, easyCBM) generate graphs automatically. If you are graphing manually, graph paper or a simple spreadsheet works well. The key is that the graph is visible, updated every time a probe is administered, and used in instructional planning.
---
The aimline divides the graph into two interpretive zones. Data points above the aimline mean the student is exceeding the expected trajectory. Data points below the aimline mean the student is falling short. Individual data points above or below the aimline on their own are not meaningful; the pattern across six to eight points is what matters.
The NCII (2013) recommends the four-point decision rule as the standard guide for data interpretation:
- Four consecutive data points above the aimline: The goal is too easy. Raise the goal.
- Four consecutive data points below the aimline: The intervention is insufficient. Change the intervention.
- Data points scattered above and below with no pattern: Continue the current intervention and collect more data.
- Data points consistently on or near the aimline: The student is on track; maintain the current approach.
This rule prevents teachers from reacting to single data points, which fluctuate for countless reasons (a difficult Monday, a late-night visit to the emergency room, a forgotten breakfast). Only sustained patterns justify a decision.
If four data points fall consecutively above the aimline, draw a new vertical phase change line and recalculate. Use the median of the most recent three to four scores as the new baseline, and set a new goal using the same growth rate formula. Do not simply extend the original aimline; doing so would understate the student's capacity and produce a goal that is no longer ambitious.
Sharing this process with students is itself instructional. Students develop metacognitive awareness about their learning when they can see their growth line rising. They also need to understand what the aimline means and help set new goals. This connects directly to what the research on formative assessment strategies identifies as self-regulated learning, one of the most powerful instructional moves available.
A student whose scores bounce between 55 and 80 WCPM over eight weeks may not trigger the four-point rule but also may not be making consistent progress. In these cases, drawing a best-fit trendline (or using the platform's trend calculation) gives a clearer picture. If the trendline slope is positive and at least as steep as the aimline, the intervention is working despite the variability. If the trendline is shallower than the aimline, the four-point rule is probably soon to be triggered.
---
This is where most teachers, and most CBM guides, stop. They explain the four-point decision rule, note that an intervention change is required, and leave the teacher to figure out what that change should be. Stecker, Fuchs, and Fuchs (2005) identified the main problem with CBM implementation. Teachers collect the data and see the flat trendline, but do not know what to do next.

The Friday Data / Tuesday Pivot addresses this gap directly. When you score Friday's probe and see that four consecutive points have fallen below the aimline, you need a systematic protocol to decide what to change by Tuesday. Not a vague aspiration to 'try something different'; a structured diagnostic sequence.
Work through the following checklist in order. Each question is a hypothesis; when you identify a plausible cause, act on it before moving to the next.
Choosing the right progress monitoring platform matters because each tool measures different skills, serves different grade levels, and costs different amounts. The table below lists six common examples rather than a market-share ranking. NCII's academic progress monitoring tools chart is the safer place to compare technical ratings, and schools should check current vendor documentation before purchase.
For individual teachers testing PM for the first time, easyCBM offers free access without requiring district approval. For schools implementing a full MTSS framework, AIMSweb Plus and FastBridge provide the multi-domain coverage and automatic reporting that data teams need. DIBELS remains the strongest choice for schools focussed specifically on reading intervention.
Collecting progress monitoring data is pointless without clear rules for acting on it. Decision rules remove subjectivity from intervention changes and ensure that struggling students receive timely support adjustments. The most widely validated approach uses the four-point decision rule developed by Fuchs and Fuchs (2007).
After collecting at least six to eight data points (roughly six to eight weeks of weekly monitoring), draw a trend line through the most recent four consecutive data points. Compare this trend line to the goal line.
If the trend line is above the goal line: The student is exceeding expectations. Raise the goal or begin fading the intervention.
If the trend line is on or near the goal line: The current intervention is working. Continue without changes.
If the trend line is below the goal line: The current intervention is insufficient. Change the intervention strategy, increase intensity, or move to a higher MTSS tier.
Check tests if data is inconsistent. A learner reading 45 words, then 82, shows test issues, not poor progress. Consider procedures before changing plans.
A common mistake is changing interventions too quickly. Research consistently shows that most reading and maths interventions need at least four to six weeks to produce measurable effects (Deno, 2003). Changing every two weeks prevents any intervention from demonstrating impact. Conversely, waiting twelve weeks to act on a flat trend line wastes valuable instructional time.
A practical guideline: review data every four weeks using the decision rule above. If two consecutive four-week reviews show a trend line below the goal line, the intervention needs changing. Document what was tried, what the data showed, and what the team decided. This documentation becomes part of the student's MTSS record and, if needed, their special education referral file.
Behaviour and social-emotional goals can also be monitored with repeated, clearly defined measures. NCII's behaviour progress monitoring tools chart describes tools that quantify rate of improvement or responsiveness to instruction, while DBR research offers one practical classroom method for repeated behaviour ratings.
Direct Behaviour Rating (DBR) is a practical tool for classroom teachers. After each lesson, the teacher rates the target behaviour on a simple scale (typically 1-5 or 1-10). Ratings take under thirty seconds and produce trend data that can be graphed alongside academic PM data. Christ, Riley-Tillman and Chafouleas (2009) describe DBR as a school-based method that combines direct observation with behaviour rating scales.
For social-emotional goals, frequency counting works well. If a student's goal is to use a self-regulation strategy independently, count how many times they use it per day. If the goal is to reduce off-task behaviour, use momentary time sampling: at fixed intervals (every five minutes), note whether the student is on-task or off-task. This produces a percentage that can be tracked over time.
Some platforms combine academic, behaviour and social-emotional screening in one system. That can help school teams coordinate MTSS data, but the article should not infer national growth or adoption without a current vendor-independent source.
AI may change how teachers gather and interpret progress-monitoring data, but this remains an emerging area. Treat automated scoring and dashboard recommendations as prompts for professional review, not as independent evidence that an intervention is working.
Automated oral reading fluency scoring uses speech recognition to score reading aloud. Before relying on automated ORF scores for intervention decisions, schools should check the platform's validation evidence, accessibility implications, privacy controls and error patterns for different groups of readers.
Predictive dashboards can flag learners for review earlier than a traditional decision-rule cycle, but they should be treated as screening signals. Teachers still need to inspect the underlying work, attendance, intervention fidelity and recent context before changing support.
Adaptive intervention matching is promising but should remain accountable to evidence. If a platform recommends a change, the team should ask what data the recommendation used, whether the tool has independent validation, and whether the suggested pivot fits the learner's observed errors.
These tools supplement rather than replace teacher judgement. PM data without contextual understanding is just numbers. A teacher who knows that a student's reading fluency dropped because their family moved house last week interprets the data differently from an algorithm that sees only the score. The most effective approach combines automated data collection with human decision-making.
1. Was the intervention implemented with fidelity?
Check your session logs. Was the intervention delivered the required number of times per week? For the full session duration? By the same person using the same materials? A student receiving a three-times-per-week fluency intervention who actually received it twice per week for three of the past four weeks has not had an adequate exposure to evaluate. Fidelity problems are not failures of the student; they are failures of the delivery system. Fix the delivery before concluding the intervention is ineffective.
Attendance records also matter here. A student who missed six of the past twelve sessions may have a flat trendline. This might not be because the intervention is wrong, but because they have not received enough of it. Cross-reference CBM data with attendance logs before making any instructional change.
2. Is the instructional match correct?
Burns (2004) linked academic skills to error rate and fluency in his teaching hierarchy. Learners struggle with material above 90% accuracy and do not learn. Independent work above 97% accuracy provides practice, but lacks challenge. The best learning happens with 93-97% accuracy, as Burns (2004) suggested.
If a student's ORF probe shows an accuracy rate below 93%, the intervention passages may be at frustration level. Drop to a lower-level passage set and re-establish baseline before concluding that a different intervention is needed. The same principle applies to maths: a student doing two-digit multiplication CBM probes with below-90% accuracy needs single-digit fluency work first. Scaffolding instruction to the correct instructional level is not accommodation; it is the precondition for growth.
| Tool | Grades | Domains | Cost | Key Strength |
|---|---|---|---|---|
| DIBELS 8th Edition | K-8 | Reading (phonemic awareness, fluency, comprehension) | Free (paper); paid for digital platform | Largest norming sample; gold standard for reading PM |
| AIMSweb Plus | K-12 | Reading, maths, writing, spelling | District licence (per-student pricing) | Multi-domain coverage; automatic graphing |
| FastBridge | K-12 | Reading, maths, behaviour, social-emotional | District licence | Includes behaviour/SEL screening alongside academics |
| easyCBM | K-8 | Reading, maths | Free (teacher version); paid for district | Free access for individual teachers; low barrier to entry |
| iReady | K-12 | Reading, maths | District licence | Adaptive diagnostic with built-in intervention lessons |
| Star Assessment (Renaissance) | K-12 | Reading, maths, early literacy | District licence | Student Growth Percentile (SGP) for state reporting |
3. Does the cognitive load need reducing?
Slow yet accurate learner responses may suggest working memory overload. Instruction might ask learners to retrieve, apply and produce all at once, creating high cognitive load. In maths, Geary's work on learning disabilities helps explain why retrieval and strategy demands can make performance slow even when some component skills are present (Geary, 2004).
Cognitive load reduces when you break tasks down. Give learners single-step practice and use worked examples first. Reduce unnecessary stimuli on the page and provide visual organisers where they help the learner focus on the target process (Sweller, 1988; Clark, Nguyen & Sweller, 2006). Fade scaffolds only when the progress data and classroom work show that fluency is becoming secure.
4. Should the modality change?
A student who has received six weeks of auditory-phonological intervention (phoneme blending, segmenting) with a flat ORF trendline may not need more of the same. They may need a visual approach: grapheme-phoneme card sorts, colour-coded word families, or a structured word study programme. Evidence for differentiated instruction shows that switching pathways can help when one is not working. For example, changing from visual to auditory, abstract to concrete, or implicit to explicit can unblock progress.
For further reading on this topic, explore our guide to Curiosity-Driven Learning.
For further reading on this topic, explore our guide to PIVATS Explained.
This is not 'learning styles' theory. This recognises that different instructional activities use different cognitive processes. A student who is not responding to one approach may respond differently to another that targets the same underlying skill through a different route.
5. Is the intervention frequency sufficient?
For students in Tier 3 with significantly below-grade-level skills, three sessions per week may not be enough. The research base for intensive intervention typically involves four to five sessions per week of 30-45 minutes each (Fuchs and Fuchs, 2007). If a student's programme delivers three 20-minute sessions per week and the trendline is flat, increasing frequency to five 30-minute sessions is a legitimate instructional change. This is distinct from changing the content of the intervention.
6. Are there confounding variables?
Before concluding that the instruction is the problem, rule out variables outside the classroom. A student who began a new medication in week four of monitoring may show a performance dip that reflects medication adjustment, not instructional failure. A student whose family experienced a significant stressor will show variability in CBM scores. These data points are real and should be noted, but they do not warrant an instructional pivot. Document confounding variables on the graph (a small note or phase change line with annotation) so the data record is interpretable.
When CBM data is flat and you have also been tracking behaviour, the picture may be more complex. Functional behaviour assessment can reveal whether avoidance behaviour is masking skill gaps or whether skill gaps are driving avoidance behaviour. The two problems require different responses.
When data is persistently flat despite systematic pivots, the situation may warrant the kind of deep diagnostic review described in guidance for IEP annual reviews where progress has stalled.
---
CBM functions differently at each tier of the MTSS framework, and the frequency of measurement reflects the intensity of support provided.
At Tier 1, all students are screened three times per year (autumn, winter, spring) using the same CBM measure. This is benchmark assessment, not progress monitoring in the strict sense. However, it serves the same measurement function by showing which students are below benchmark and need closer attention.
The cut-point for identifying risk typically falls at the 25th percentile for the grade-level benchmark. Students below this threshold are candidates for Tier 2 support. Students between the 25th and 40th percentiles may need closer monitoring before a formal intervention assignment.
Students receiving Tier 2 intervention should be monitored every two weeks. Fourteen days gives enough time to collect two to three data points and see a pattern. This prevents students from spending six weeks in an ineffective intervention before anyone notices. After approximately eight to ten data points (roughly four to five weeks of biweekly monitoring), apply the four-point decision rule.
If a Tier 2 student is responding well (trendline meeting or exceeding the aimline), they may be stepped down to Tier 1 with continued benchmark screening. If they are not responding, the decision moves to either intensifying the Tier 2 intervention or escalating to Tier 3.
Weekly progress monitoring is the standard at Tier 3. Students at this tier are receiving intensive intervention and the decision-making pace should match the intervention intensity. Weekly data points allow the four-point rule to be applied after approximately four weeks, meaning a student who is not responding to Tier 3 intervention can be identified and referred for thorough evaluation within six to eight weeks rather than waiting months.
CBM data is key for special education eligibility. Poor response to strong Tier 3 support, shown in CBM graphs, suggests learning disability (IDEA). Your Tier 3 CBM record helps show eligibility. Thus, data quality is important legally and for teaching.
---
The gap between what CBM can do and what it typically does in schools reflects a predictable set of implementation errors. These are worth naming directly.
According to Deno (2003), administer tests consistently. Extra time, format changes or corrections make progress data harder to interpret because the score change may reflect the changed conditions rather than learning. Standardisation is what makes week-to-week comparisons meaningful.
Irregular scheduling. Collecting CBM every three to five weeks rather than weekly or biweekly produces too few data points for the four-point decision rule to function. Four consecutive points below the aimline needs four data points. If these are collected over 20 weeks, the student has spent 20 weeks in an intervention that may not work.
Graphing delays. Scoring probes but not graphing them for a week negates the formative purpose of the tool. The graph must be updated immediately after scoring so it can be used for planning. A stack of unplotted probes is an archive, not a monitoring system.
Ignoring decision rules. The four-point rule exists because teachers reliably over-interpret random variation and under-react to sustained patterns. 'I know he can do better than this' is not a decision rule. 'Four consecutive points below the aimline' is. Trusting the rule over the intuition is not a failure of professional judgement; it is professional judgement informed by evidence.
Testing but not teaching. Some students receive CBM probes reliably but receive little change in their instruction regardless of the results. The probe scores become an administrative record rather than an instructional tool. This is the pattern Stecker, Fuchs, and Fuchs (2005) identified as the primary failure mode: data collected, not used.

Using CBM as punishment. In some school cultures, CBM probes are associated exclusively with being 'pulled out' or identified as struggling. When students experience the probe as a stressor rather than a growth tool, performance anxiety contaminates the scores. Sharing the graph with the student, celebrating upwards trends, and framing each probe as a chance to see how much they have grown reframes the process. Students who monitor their own progress show greater motivation and self-efficacy in classroom research, consistent with findings on retrieval practice and self-regulation.
Failing to share data with students. This is the missed opportunity most often overlooked. The student is the person most motivated to understand their own learning trajectory. A student who knows their baseline, understands their goal, and can read their own graph relates to their intervention very differently. This is unlike students who simply turn up for sessions.
---
American CBM is heavily quantified: standardised probes, normative tables, WCPM targets, four-point rules. This is both its strength and its limitation. The precision of the measurement system produces defensible, replicable data. It can also produce a narrowing of attention to what is measured at the expense of what is not.
Black and Wiliam (1998) reviewed formative assessment research. They argued that feedback quality depends on how well the teacher understands the student, not just measurement quality. Their review of 580 studies found that rich, specific, growth-oriented feedback produced effect sizes of 0.4 to 0.7. They were not describing CBM probes; they were describing the kind of moment-to-moment, observation-based assessment that sits alongside any measurement system.
Black and Wiliam's formative assessment uses teacher judgement and observation. It builds rich understanding of each learner's context. However, showing learner progress for legal requirements can be tricky.
Best practice blends both. Use CBM for its rigour and its legal defensibility. Use formative observation and professional judgement for the context that makes the numbers meaningful. A student's ORF score of 68 WCPM tells you they are below the Grade 3 benchmark. Watch the specific words they stumble over, the patterns in their mistakes, and their face when they meet long words. This tells you what to teach next. Neither alone is sufficient.
---
Curriculum-Based Measurement is a standardised method of assessing student performance using brief, timed probes. Instead of testing a single skill, these probes sample the entire curriculum that a student is expected to master by the end of the year. This provides a reliable trajectory of learning growth over time to help guide teaching decisions.
A standard unit test checks if a student has acquired specific skills taught over the last few weeks. In contrast, progress monitoring uses a curriculum sampling approach to measure overall proficiency across the entire academic year. This ensures students are building genuine fluency rather than just memorising isolated chunks of information.
Teachers administer short assessments under identical conditions on a regular schedule throughout the school year. For most students, this happens three times a year as a general benchmark screening. For learners requiring additional targeted support, teachers might administer these probes weekly or biweekly to track if their current interventions are effective.
Progress monitoring improves learner outcomes when teachers use the data to change instruction. Fuchs and Fuchs' formative-evaluation meta-analysis found an average weighted effect size of .70, and Stecker, Fuchs and Fuchs later emphasised that data collection alone is not enough; teachers must use the scores to adjust teaching.
The most frequent mistake is altering the standardised instructions or timing during the assessment. If the administration conditions change between sessions, the variance in scores will reflect the altered procedure rather than actual student learning. Another common error is gathering the data but failing to use a structured decision protocol to pivot when a student's trendline remains stubbornly flat.
Downloadable Structural Learning presentation on Progress Monitoring and Curriculum-Based Measurement, built for quick CPD, self-study, or team discussion.
Download Slides (.pptx)PowerPoint format. Compatible with Google Slides and LibreOffice.
Deno (1985) introduced curriculum-based measurement as a practical alternative for direct, repeated measurement of academic growth in special education.
Fuchs and Fuchs (1986) meta-analysed 21 controlled studies of formative evaluation procedures and reported an average weighted effect size of .70.
Stecker, Fuchs and Fuchs (2005) reviewed CBM implementation research and highlighted the crucial distinction between collecting progress data and using it to change instruction.
Hasbrouck and Tindal (2006) provide widely cited oral-reading-fluency norms that help teachers interpret WCPM scores without turning them into a single universal benchmark.
NCII's Data-Based Individualization framework describes how validated interventions, progress monitoring, diagnostic data and adaptation cycles fit together for learners who need intensive support.
---
Black, P., & Wiliam, D. (1998). Assessment and classroom learning. Assessment in Education: Principles, Policy and Practice, 5(1), 7-74. https://doi.org/10.1080/0969595980050102
Burns, M. K. (2004). Empirical analysis of drill ratio research. Remedial and Special Education, 25(3), 167-173. https://doi.org/10.1177/07419325040250030401
Christ, T. J., Riley-Tillman, T. C., & Chafouleas, S. M. (2009). Foundation for the development and use of direct behavior rating to assess and evaluate student behavior. Assessment for Effective Intervention, 34(4), 201-213. https://doi.org/10.1177/1534508409340390
Deno, S. L. (1985). Curriculum-based measurement: The emerging alternative. Exceptional Children, 52(3), 219-232. PubMed record
Fuchs, L. S., & Fuchs, D. (1986). Effects of systematic formative evaluation: A meta-analysis. Exceptional Children, 53(3), 199-208. https://doi.org/10.1177/001440298605300301
Fuchs, L. S., & Fuchs, D. (2007). A model for implementing responsiveness to intervention. Teaching Exceptional Children, 39(5), 14-20. https://doi.org/10.1177/004005990703900503
Fuchs, L. S., Fuchs, D., Hamlett, C. L., Walz, L., & Germann, G. (1993). Formative evaluation of academic progress: How much growth can we expect? School Psychology Review, 22(1), 27-48. https://doi.org/10.1080/02796015.1993.12085636
Furey, W. M., Marcotte, A. M., Hintze, J. M., & Shackett, C. (2016). Concurrent validity and classification accuracy of curriculum-based measurement for written expression. School Psychology Quarterly, 31(3), 369-382. PubMed record
Hasbrouck, J., & Tindal, G. A. (2006). Oral reading fluency norms: A valuable assessment tool for reading teachers. The Reading Teacher, 59(7), 636-644. https://doi.org/10.1598/rt.59.7.3
National Center on Intensive Intervention. (2013). Data-Based Individualization: A framework for intensive intervention. ERIC PDF record
National Center on Intensive Intervention. Academic progress monitoring tools chart. https://charts.intensiveintervention.org/aprogressmonitoring
National Center on Intensive Intervention. Behaviour progress monitoring tools chart. https://charts.intensiveintervention.org/bprogressmonitoring
Stecker, P. M., Fuchs, L. S., & Fuchs, D. (2005). Using curriculum-based measurement to improve student achievement: Review of research. Psychology in the Schools, 42(8), 795-819. https://doi.org/10.1002/pits.20113
University of Oregon. DIBELS 8th Edition official materials. https://dibels.uoregon.edu/
---
Pick one student whose progress you are uncertain about and administer three ORF or maths computation probes this week. Establish a median baseline. Set a goal using the grade-level growth rate for your tier. Then graph it. The act of graphing a baseline is the most consequential first step: once the line exists, it makes absence of growth visible, and visible problems get solved.