Updated on
October 7, 2026
CHC Theory: The Cattell-Horn-Carroll Model Explained
CHC theory explained: Cattell and Horn's Gf-Gc model, Carroll's three-stratum theory, later synthesis, broad abilities, evidence and assessment limits.


Updated on
October 7, 2026
CHC theory explained: Cattell and Horn's Gf-Gc model, Carroll's three-stratum theory, later synthesis, broad abilities, evidence and assessment limits.
What is CHC theory?
CHC theory (Cattell-Horn-Carroll) is a model of cognitive abilities built from patterns in test scores. It brings together Cattell and Horn's fluid and crystallised abilities with Carroll's three-stratum theory: narrow abilities, broad abilities and, in Carroll's version, general ability, g. Versions differ in their labels and hierarchy. Test publishers use it to organise what their tasks measure.
You may meet CHC (Cattell-Horn-Carroll) in a psychology course, a test manual or a cognitive assessment report. Its codes help you follow what a researcher or test author claims to measure. The useful starting questions are which version they use and which tasks support each label.
Read the history first, then compare the broad abilities with example tasks. The three-stratum diagram shows Carroll's hierarchy. Later sections examine how tests fit the model, how abilities change with age and why scholars debate the value of a cognitive profile.
Keep three questions separate as you read: which version is being described, which tasks sample its abilities and which claims the evidence supports.
The structure describes links between scores. Explaining how people learn and why their abilities differ calls for other kinds of evidence.
| Term | Meaning |
|---|---|
| Taxonomy | A taxonomy puts related observations under common labels. |
| Factors | CHC researchers ask which test results tend to rise and fall together. They infer factors from those patterns. These factors are latent constructs: researchers estimate them through scores rather than observe them directly. |
This focus differs from an instructional learning theory, which asks how people gain knowledge. CHC describes ability structure and supplies shared terms. It is not a map of brain regions, a diagnosis, a system of learner types or a guide to how someone should be taught. Choosing a task or intervention requires evidence about learning and the particular skill.
The phrase “CHC theory” can hide real disagreement. Some writers use it for a broad synthesis of the Cattell-Horn and Carroll traditions. Others separate Carroll's model, later three-stratum CHC (3S-CHC) revisions and extended Gf-Gc versions whose highest level consists of broad abilities (McGrew, 2023).
CHC grew from several linked research programmes. Cattell tested a split between fluid and crystallised intelligence. Horn added more broad abilities. Carroll later built his hierarchy from a large review of factor-analytic studies.
Carroll built a three-stratum theory. McGrew then played a central part in the later CHC synthesis and its terms.

The fluid-crystallised split has a complex origin. Letters between Donald Hebb and Raymond Cattell helped shape it (Brown, 2016). Cattell then tested fluid and crystallised factors in his 1963 study.
| Broad ability | What it covers |
|---|---|
| Gf | Fluid reasoning, Gf, covers induction and deduction with fairly new information. It is often described as reasoning with unfamiliar material. Language, task familiarity and past experience still shape performance on these tests. |
| Gc | Crystallised ability, Gc, covers learned comprehension and knowledge that a culture values. Our separate account of fluid intelligence explores this split in more depth. |
Horn and Cattell went beyond the first two-factor account. They found further broad dimensions (Horn and Cattell, 1966). Horn's later extended Gf-Gc model kept broad abilities at its highest level. Carroll placed a general factor above them. That difference matters when you compare their diagrams.
Carroll took a different route through the evidence. He reanalysed more than 460 data sets from much of the twentieth century. His 1993 book grouped abilities into three strata.
Carroll named eight broad factors at stratum II (Carroll, 1993). The first four were fluid intelligence, crystallised intelligence, general memory and learning, and broad visual perception. The other four were broad auditory perception, broad retrieval ability, broad cognitive speediness and processing speed. Above them he placed a single general factor. Below them sat the narrow abilities that specific tasks sample.
McGrew (2009) later set out the many links between Carroll's broad factors and the extended Cattell-Horn taxonomy. He also noted their differences.
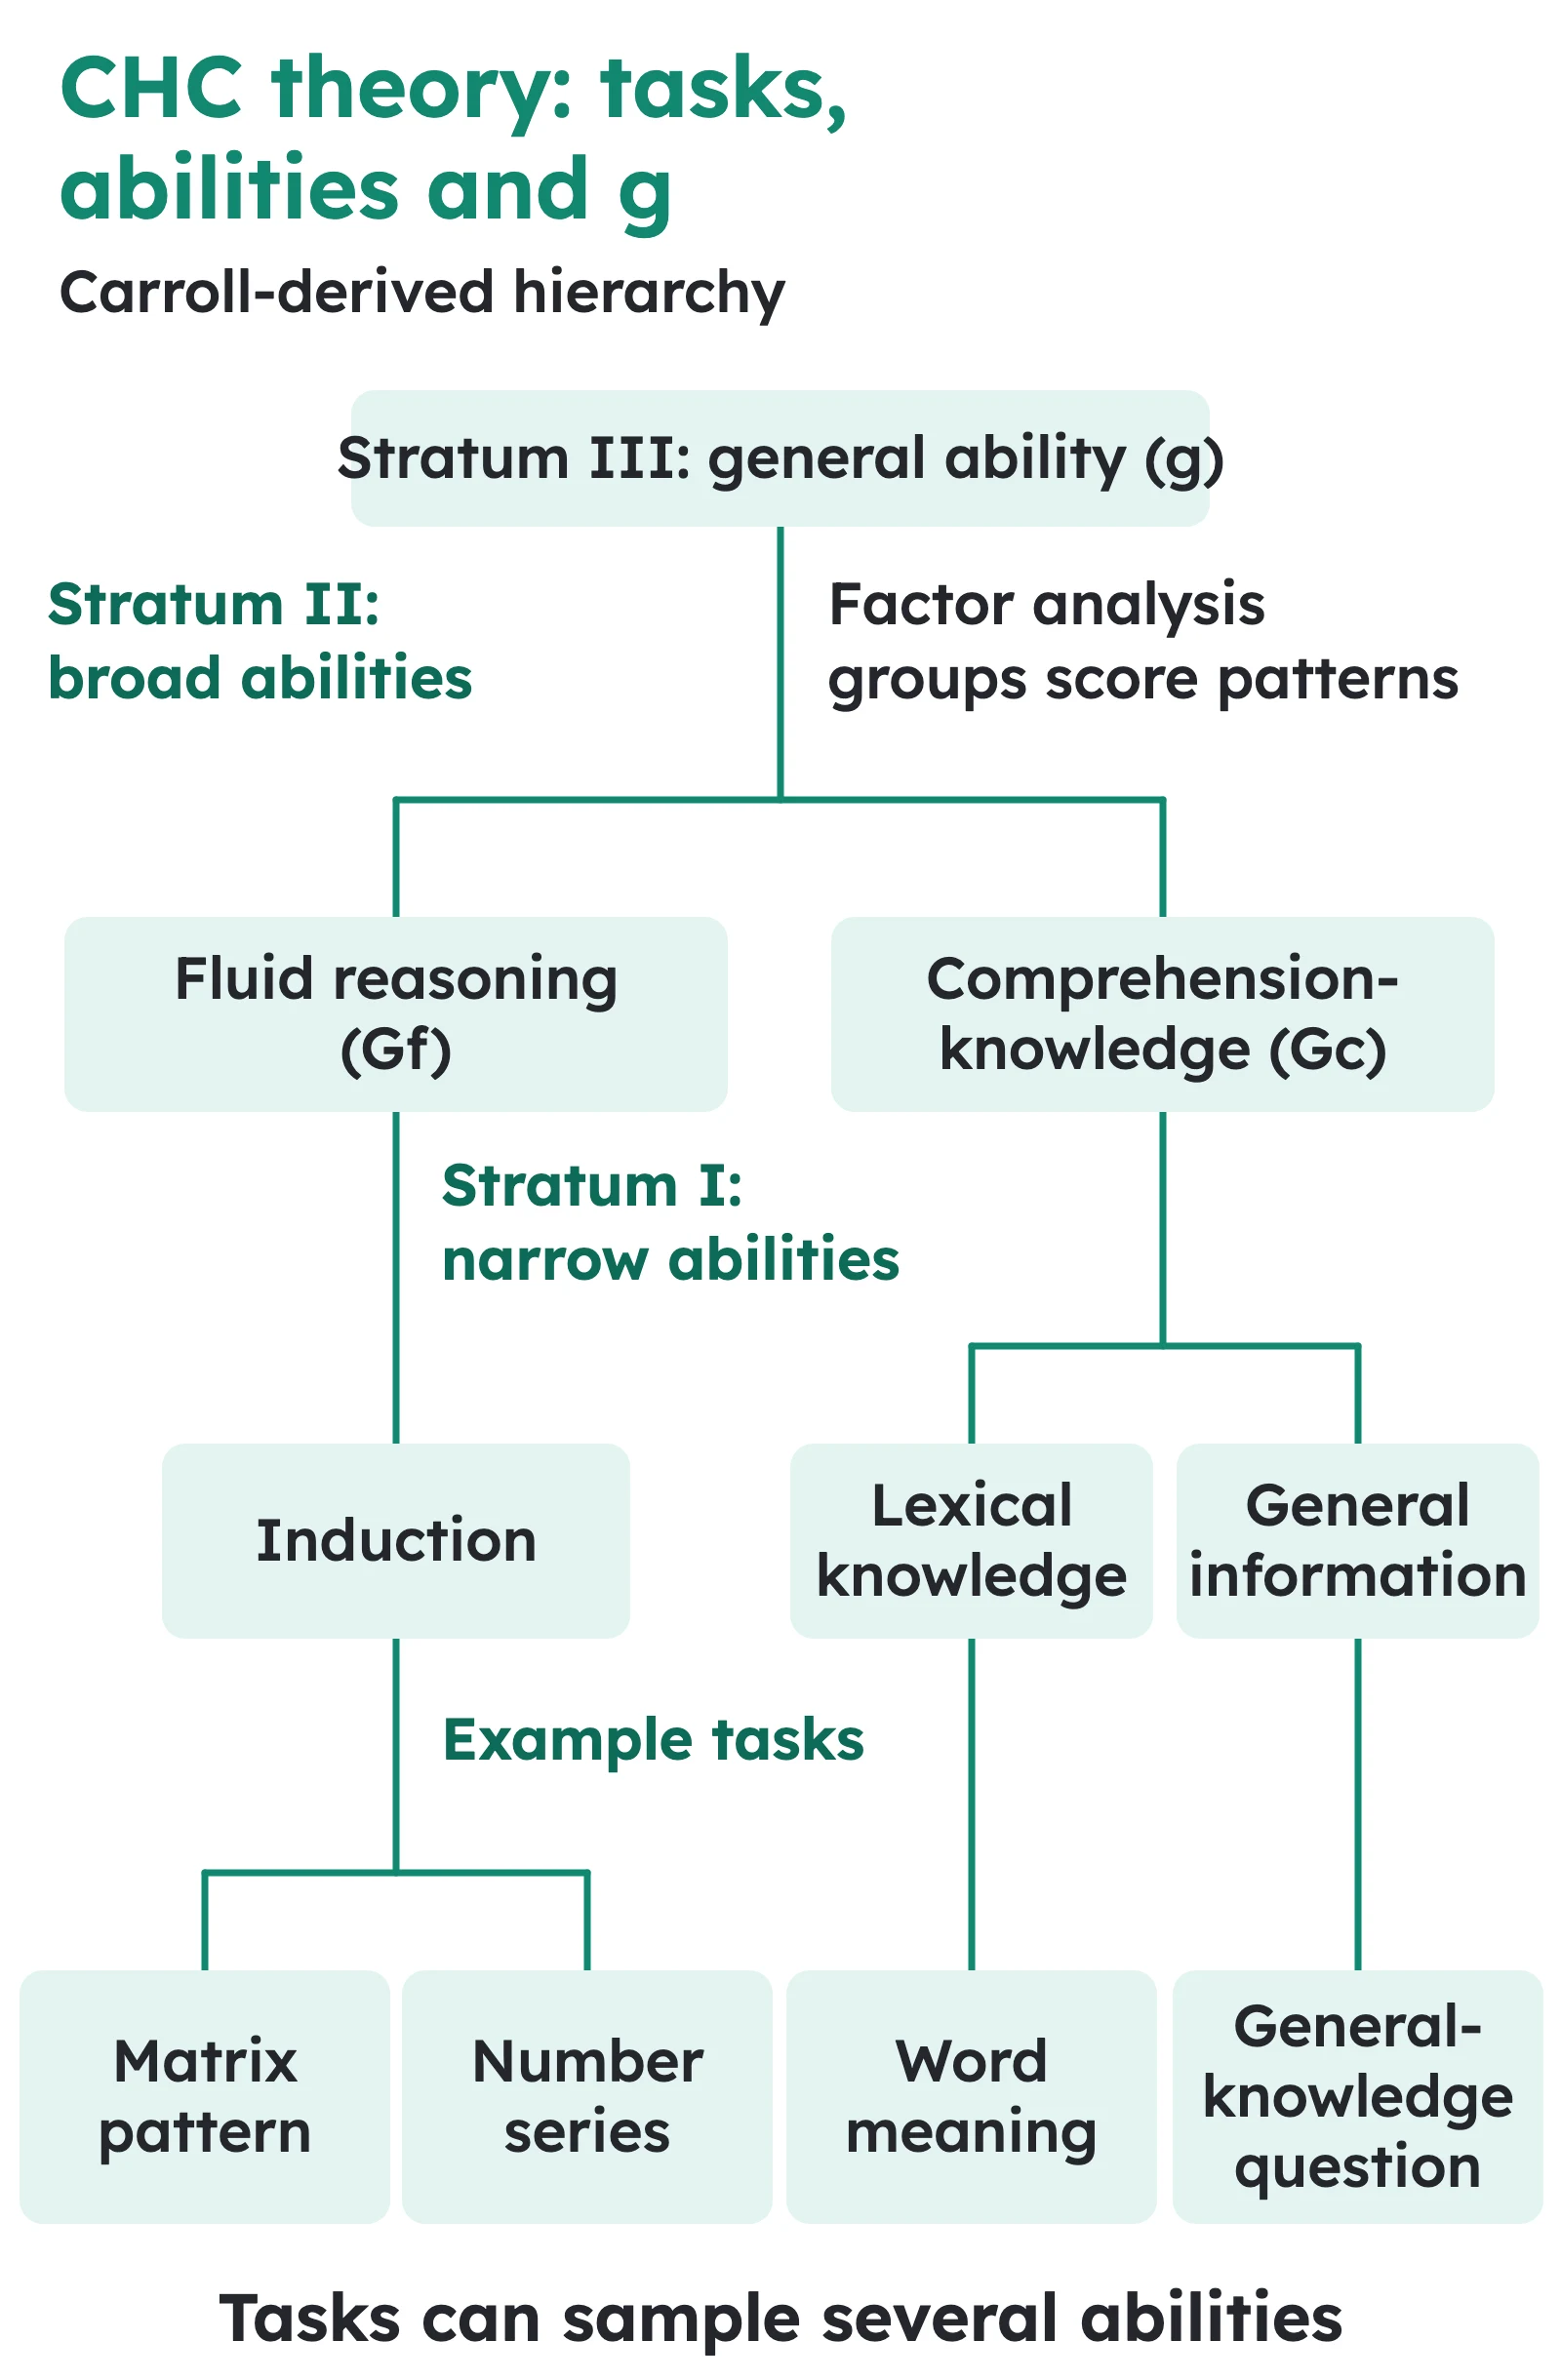
Carroll's theory has three strata. Fairly specific abilities sit at stratum I. Broad factors sit at stratum II, and general ability sits at stratum III. Later writers often use this hierarchy to explain CHC.
Label this hierarchy as Carroll-derived or 3S-CHC so readers can distinguish it from the earlier Cattell-Horn model.
The strata are levels of breadth in a statistical model. They summarise how measured results vary together in specified data sets. Stages in human growth and locations in the brain answer different questions.
The diagram below draws Carroll's version. Each line shows where factor analysis grouped an ability within the hierarchy.
General ability (g)
What nearly all cognitive tasks share. Carroll kept a single g at the top; Horn's extended Gf-Gc model did not.
Eight broad abilities in Carroll (1993)
Narrow abilities
Dozens of specific abilities, such as induction, vocabulary knowledge, memory span and perceptual speed. A single subtest samples one or more of them.
Two points help you read the picture. The middle row is Carroll's 1993 list, which later CHC versions have split and extended. A test usually samples a broad ability through a small set of subtests, then combines their results into an index.
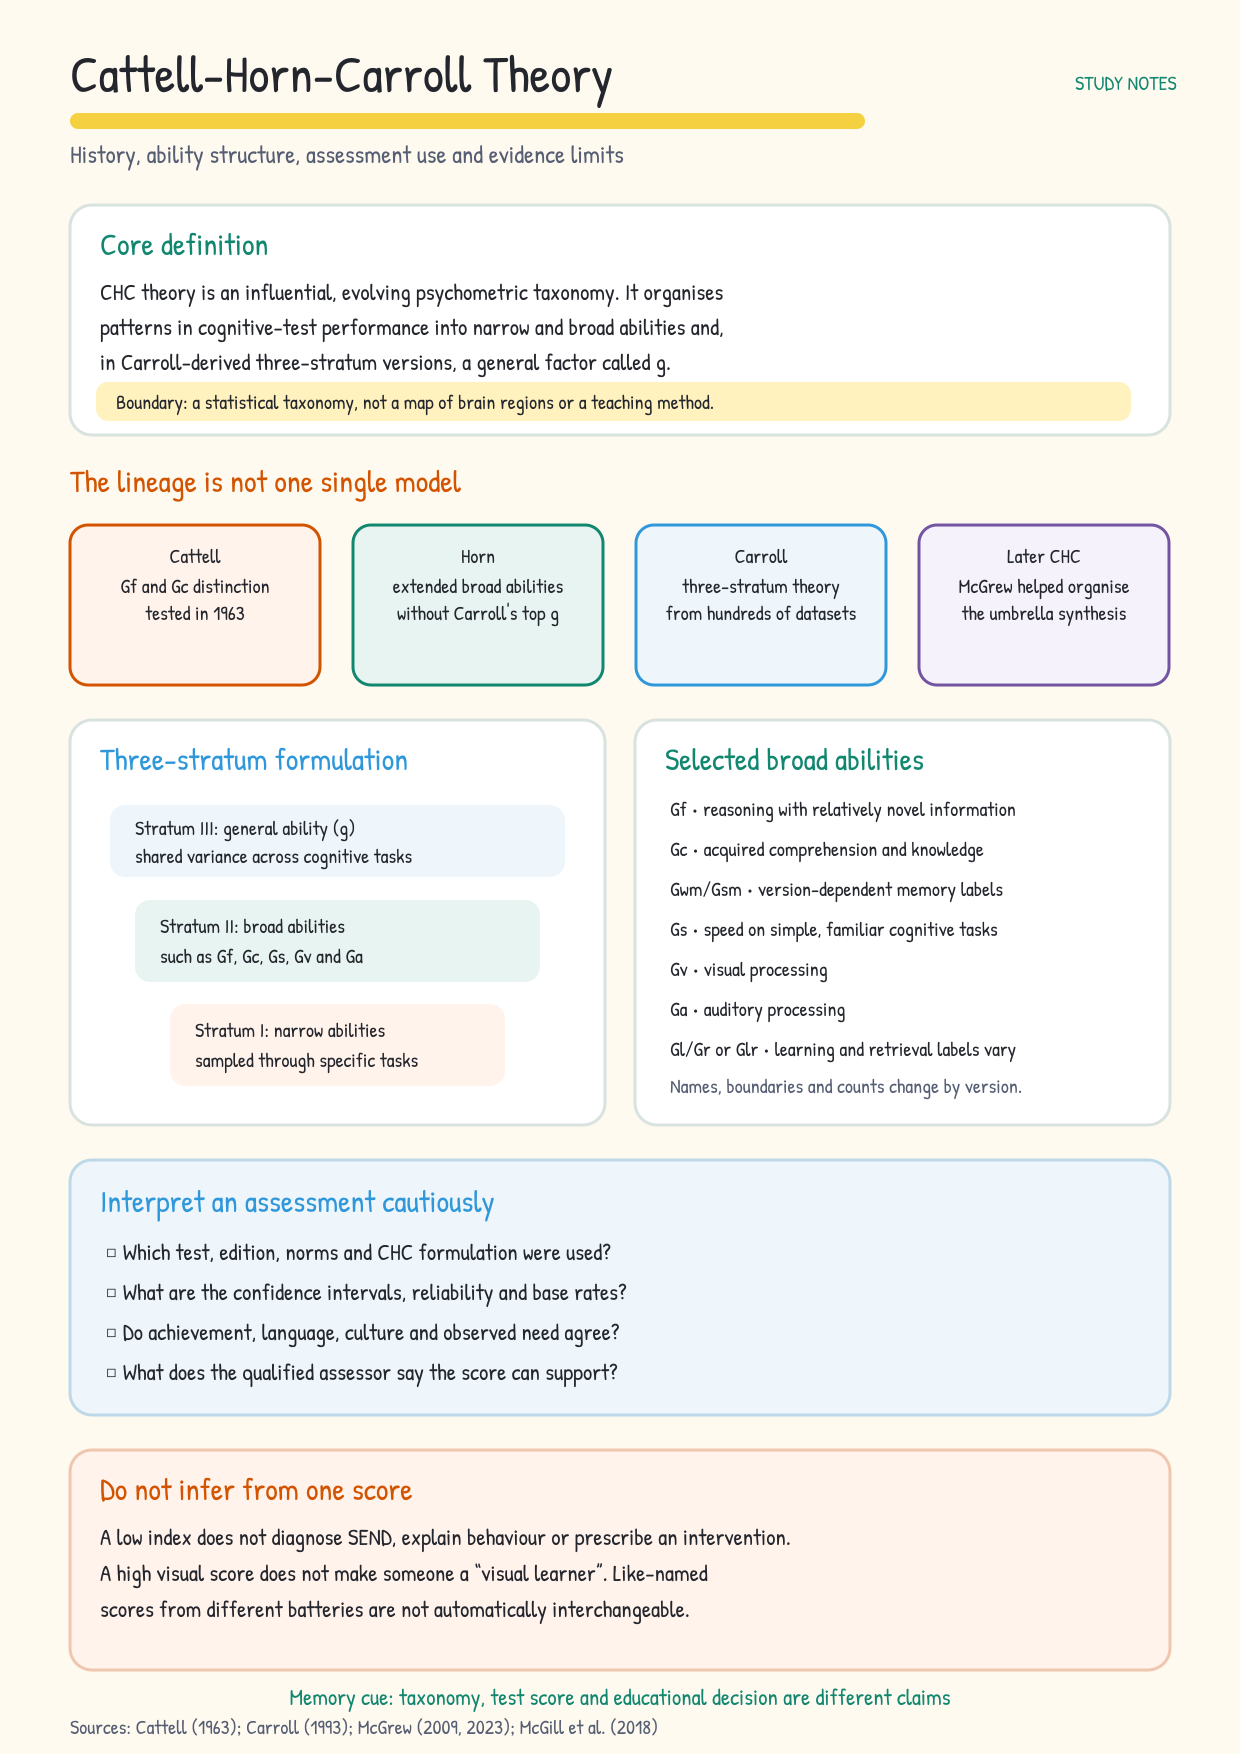
Core definition: CHC theory is an influential and evolving psychometric taxonomy. It groups patterns in test results into narrow and broad abilities. Versions based on Carroll also include a general factor called g. CHC is not a brain map or teaching method.
Lineage: Cattell tested the Gf-Gc split in 1963. Horn added broad abilities but did not adopt Carroll's top g in the same form. Carroll built a three-stratum theory from more than 460 data sets. McGrew helped organise the later umbrella synthesis.
Three-stratum version: stratum I contains narrow abilities sampled through tasks. Stratum II contains broad abilities. Stratum III contains general ability.
Selected broad labels include Gf, Gc, Gs, Gv and Ga. Labels for memory, learning and retrieval vary by version.
Limits on use: ask which test, edition, norms and CHC version were used. Check confidence intervals, reliability and base rates. Add evidence about attainment, language, culture and observed need. Follow the qualified assessor's account of what the score can support.
Do not infer from one score: a low index cannot diagnose SEND, explain behaviour or prescribe an intervention. A high visual score does not make someone a visual learner. Scores with the same name in different batteries may not mean the same thing.
CHC ability lists depend on the version and date. The table gives selected common labels and typical tasks, which vary by battery. Each construct is broader than one subtest. Use the final column to separate what a task samples from wider claims about the score.
Swipe across to read all columns on a smaller screen.
| Label | Broad construct | Typical task, varies by battery | Boundary |
|---|---|---|---|
| Gf | Induction and deduction with fairly new information. | Complete a matrix or work out the next item in a new pattern. | Performance still draws on learned knowledge and task familiarity. |
| Gc | Acquired comprehension and culturally valued knowledge. | Explain a word or answer a general-knowledge question. | Language, education, culture and opportunity affect the sampled knowledge. |
| Gwm or Gsm | Working-memory capacity or short-term memory, based on the version. | Repeat digits forward for memory span; reorder them for working memory. | Do not swap the labels without the right taxonomy and test manual. |
| Gs | Speed and fluency on simple, familiar cognitive tasks. | Match symbols or mark target patterns within a time limit. | A score does not prove how quickly someone understands authentic school work. |
| Gv | Seeing, analysing and changing visual patterns. | Copy a block design or mentally rotate a shape. | It does not show a visual learning style or preferred way to teach. |
| Ga | Auditory discrimination and processing. | Distinguish sound patterns or identify a change in pitch. | It is not equivalent to phonics skill, reading ability or a diagnosis. |
| Gl and Gr, or Glr | Learning efficiency and retrieval fluency, or an older joint storage-retrieval construct. | Gl: learn paired items. Gr: name words in a category. Older Glr combines learning and retrieval. | New and old lists divide this area in different ways. |
| Gq, Grw and Gt | Quantitative knowledge, reading-writing ability and reaction-decision speed. | Gq: use number knowledge. Grw: read words or spell. Gt: react to a signal or choose a response. | Some formulations place acquired achievement domains or speed constructs differently. |
An old paper and a new report may use different codes while following their own taxonomies. Some current accounts split working-memory capacity from older short-term-memory terms. Check the cited CHC version and test manual before translating a label into another list.
Carroll's 1993 model has eight broad abilities. Flanagan and Dixon's 2014 account lists 16 broad and over 80 narrow abilities. The count depends on the version and level. The Flanagan and Dixon chapter gives that expanded list. A battery samples a selection from the taxonomy.
Fluid intelligence has no single fixed peak age. Tasks grouped under that name peak at different ages. The sample and measure affect the result. Horn and Cattell (1967) found higher fluid scores in younger groups and higher crystallised scores in older groups.
McArdle et al. (2002) modelled different growth and decline curves for abilities measured with the Woodcock-Johnson. Hartshorne and Germine (2015) found that different tasks peaked at widely differing ages, some as late as the 40s. These are group patterns; our fluid and crystallised intelligence guide explains the distinction further.
Processing speed, Gs, samples speed and fluency on simple, familiar tasks. Examples include finding matching symbols or marking target patterns within a set time. A lower score records slower performance on those tasks. Reading a long passage or planning an answer places other demands on the learner. Compare the task with the account of working memory in learning.
| Evidence source | What it shows |
|---|---|
| Across batteries | Studies across batteries have found strong links among broad constructs sampled by different tests (Reynolds et al., 2013; Caemmerer et al., 2020). This supports CHC as a useful shared taxonomy. Each score group and proposed use still needs evidence from its own battery. |
| Across national samples | Studies of single batteries offer another kind of evidence. Some studies of the Wechsler Intelligence Scale for Children, Fifth Edition (WISC-V) found similar factor structures in several national norm samples (Wilson et al., 2023, 2024). These results apply to the named tests, samples and models. Cultural bias, prediction and fairness of use each require their own evidence. |
| Knowledge and culture | Knowledge factors need special care. Gc samples learned knowledge that a culture values. Language, schooling and access to knowledge therefore matter. |
This is evidence about structure. It asks whether a chosen latent model can account for score patterns at group level. The meaning of a named index depends on its tasks and battery. Evidence about the stability of an individual profile answers a separate question. Nor does it show that one person's profile is stable or can diagnose a learning difficulty.
Research still changes the taxonomy. McGrew (2023) separates Carroll's three-stratum legacy from broader uses of CHC and sets out new boundaries. Scholars still debate whether g, Gf and other broad factors can be told apart in a sound and stable way. This is part of current work on the theory.
A cross-national study of declarative knowledge examined how far knowledge items depend on the country they come from (Watrin et al., 2023). Gc therefore needs to be read in relation to the knowledge, language and opportunities sampled by the test.
This is the question most school staff care about. If a report shows a profile, can it tell you which support will work? Several studies have tested this directly, mostly in reading.
| Review | Finding |
|---|---|
| Stuebing et al. (2009) | Stuebing et al. (2009) combined 22 studies. The intelligence quotient (IQ) explained about 3% of the variation in response to reading instruction when prior reading was in the model, and between 0.6% and 1.3% once other factors were added. |
| Stuebing et al. (2015) | A later meta-analysis of 28 studies found that cognitive measures correlated only r = .15 with reading after teaching, once reading before teaching was known (Stuebing et al., 2015). |
| Evidence source | What it shows |
|---|---|
| Miciak et al. (2016) | Studies of profiles point the same way. Miciak et al. (2016) sorted 203 learners with two strengths-and-weaknesses methods before an intensive reading programme. The two methods agreed poorly, and neither grouping predicted who would respond better. |
| Burns et al. (2016) | Burns et al. (2016) found that interventions built from cognitive measures had a small effect (g = 0.17). Those built from direct measures of reading fluency or phonological awareness had moderate effects (g = 0.43 and 0.48). |
The evidence includes dissent. One study found that two language and cognitive profiles predicted response to comprehension teaching (Kulesz et al., 2024). Decker and Luedke (2021) argue that few studies were designed to test the question well. For now, direct measures of the skill are the stronger guide to planning support.
CHC matters in schools because its terms shape cognitive tests and reports. It can help a school leader see which construct a qualified assessor meant to sample. Reading the report still requires the assessor's account, and planning support requires evidence about the learner's needs.
| Evidence source | What it shows |
|---|---|
| Named batteries | The Woodcock-Johnson family is built around CHC. The Kaufman Assessment Battery for Children, Second Edition (KABC-II), has also been studied using CHC-related models. So have the Differential Ability Scales, Second Edition (DAS-II), and WISC-V. Each battery has its own tasks and scoring structure. Woodcock-Johnson IV and V are different editions. KABC-II can be interpreted through more than one theoretical framework. |
| Later factor models | Dombrowski, McGill and Morgan (2021) found a better fit for higher-order models in the DAS-II and KABC-II, and for bifactor models in the WISC-V and Woodcock-Johnson IV. |
| Earlier editions | Cucina and Howardson (2017) found strong general factors in four earlier batteries. Their findings concern those editions, rather than the later Woodcock-Johnson V. The distinction is between a test's theoretical design and the structure researchers recover from its scores. |
Several intelligence batteries group scores around constructs that align with CHC. The match is approximate. Wechsler indices, for example, combine tasks chosen by the publisher.
The tasks may load on more than one factor and share method effects. A report should name the test, edition and sound use of its scores. A familiar label may not mean the same thing in every battery.
Group reasoning tests sit next to this work, but they have their own manuals and studies. Our overview of the Cognitive Abilities Test explains this type of test. The Cognitive Abilities Test (CAT4) guide covers that battery's own verbal, quantitative, non-verbal and spatial scores. Treating those strands as CHC factors requires evidence from the manual.
The wider set of thinking skills assessments contains tools with different aims and claims. CHC can supply terms for constructs. The named test must supply its own norms, precision, validity evidence and rules for use.
Staff who work with these reports describe what they do with working memory in the table below. Read each routine beside the evidence column, which says how far the research supports it.
Staff on social media rarely mention CHC or index scores. When they talk about working memory, they mean the lesson, the exam arrangement or the wait for an assessment. Here are three routines, what you would notice when they work, and what the evidence says.
| Routine, as teachers describe it | What you would notice | What the evidence says |
|---|---|---|
| Planning lessons around working-memory limits | ||
Started planning w/ working memory in mind in my Algebra I class about a 1.5 yrs ago - it was a game changer for my students! |
Fewer learners losing the thread partway through a multi-step method. | This is design for every learner, so it does not need a profile. The evidence check above found that cognitive profiles add little to planning once current attainment is known. |
| Asking what a task makes a learner hold in mind before adding extra time | ||
given extra time for tests on the assumption that they have slower processing rates, when the more accurate assessment is that they are doing complex tasks purely from working memory |
Whether the learner stalls at the same step however long they are given. | A low speed score says a learner was slower on simple timed tasks, not why a complex task breaks down. For exam extra time, follow the evidence rules in the current JCQ Access Arrangements and Reasonable Adjustments document. |
| Starting classroom adjustments while a learner waits for an educational psychologist | ||
the council my school is under only provides 10 hours worth of educational psychologist time. We have 30 children waiting to be seen. |
Whether shorter instructions, fewer steps to hold and time to think change what the learner can do now. | Direct measures of the skill are the better guide to support. Interventions planned from them showed g = 0.43 to 0.48, against 0.17 for those planned from cognitive measures (Burns et al., 2016). |
The three routines share one thing. Each starts from what the learner does in class and uses any report to sharpen a question, not to settle it.
A second context: Year 5 maths. If learners lose the thread midway through a multi-step method, leave the steps visible and check where it breaks down. This follows the working-memory routine above and keeps the decision tied to observed task performance.
A cognitive report is a qualified judgement based on several sources. Start with the referral question. Then check the test and edition, the norm group and the assessor's stated limits. A cause for the lowest score needs evidence beyond its position in the profile.
School staff can ask sound questions without doing their own test analysis. Which construct did this task sample? How precise is the estimate? Is the difference rare, and does other evidence support it?
What other causes did the assessor consider? What separate evidence supports the advice?
Reports like this often arrive during special educational needs planning, when time is short. The checker below takes seven phrases that often appear in reports. For each one it gives what the phrase measures, what it cannot tell you and a question to put to the assessor.
Write the answers beside the report. The next review can then separate claims that rest on scores from claims that rest on classroom evidence.
Try this with the next cognitive report that reaches you. Pick the two scores the report leans on most. For each one, note the construct it samples, its confidence interval and the classroom evidence that fits or does not fit it. Take those notes to the review meeting, and ask which direct measure of the skill will show whether the support is working.
CHC does not reveal a preferred way to teach, diagnose SEND or set an intervention. It cannot explain why one person lost track of an instruction, worked slowly or found reading hard. Those are questions about causes and education. A latent ability label cannot answer them on its own.
A high Gv score does not make someone a visual learner. Evidence on learning styles does not support matching teaching to a preferred sense. CHC does not provide an exception. A measured visual construct and a claimed teaching preference are different ideas.
A low memory score does not prove the cause of behaviour in class. Our article on working memory covers that construct and its evidence. Cognitive load theory deals with limits during learning. Neither source turns one cognitive index into a diagnosis.
Two parents on social media describe the scores in a report. Their words, quoted exactly.
Very low working memory and extremely low processing speed. Teacher implied he's lazy.
My eldest had a measured 40-point gap between his nonverbal and verbal IQ on a WISC-IV.
CHC also differs from cognitivism. Cognitivist accounts ask how people represent, process and learn information. CHC mainly sorts the ways in which test results vary together. The two frameworks use words such as memory and reasoning to answer different questions.
CHC's main strength is its broad taxonomy. Its main risk is that readers may mistake a taxonomy for a cause. Factor analysis can show that results cluster under a chosen model. On its own, it cannot explain which mental or brain processes caused those links.
The hierarchy also depends on the model. Choices about tasks, samples, factor methods and rules can change which factors seem distinct. McGill and Dombrowski (2019) note that CHC has shaped test design. They also ask how closely some published tests match the model they claim to use.
General and broad scores both need evidence tied to their purpose. It is too strong to say that a full-scale score hides the “real profile”. General ability can account for substantial reliable common variance. The extra value of broad scores varies by battery and decision.
Methods based on profiles of learning disability face stronger criticism. Reviews and studies find low agreement between some patterns-of-strengths-and-weaknesses methods. They also find limits in external validity and weak support for matching interventions to profiles (Miciak et al., 2014, 2016; McGill et al., 2018).
These findings challenge some uses in diagnosis and treatment. They do not reject the whole CHC taxonomy.
Factor structure alone cannot prove fairness. A model may fit several groups while items, norms or language demands still differ. Links with later outcomes and the effects of test use may differ too. Sound use therefore needs evidence about the named test, population and decision.
CHC does not cover all forms of intelligence. Many cognitive batteries leave out some or all of motivation, creativity, adaptive skills and expertise. They may also miss cultural views of competent action. CHC should be judged by the question it answers, not used as a full list of human capability.
Other models ask different questions. The comparison below shows how their organising principles differ.
| Model | Question or organising principle |
|---|---|
| Guilford | Guilford's structure of intellect sorted abilities by content, operation and product rather than by a hierarchy. |
| Sternberg and Gardner | Sternberg's triarchic theory adds creative and practical intelligence, and Gardner's multiple intelligences names abilities that no single test battery samples. |
Our overview of theories of intelligence compares them. Read each model in relation to the question it answers.
CHC stands for Cattell-Horn-Carroll. The name refers to Cattell's Gf-Gc work, Horn's extended broad-ability model and Carroll's three-stratum theory. It also marks later scholarship that brought their many areas of agreement under one name.
IQ is a score, or set of scores, from a named test. CHC is a taxonomy for cognitive constructs and their hierarchy. A general score may relate to stratum III g.
Broad and narrow scores may sample other levels. The exact link depends on the battery.
Carroll's 1993 account lists eight broad abilities. Flanagan and Dixon's 2014 account lists 16 broad and over 80 narrow abilities. The count depends on the model's version and level. A test battery samples a selection of these abilities.
A common seven-area summary includes fluid reasoning (Gf), comprehension-knowledge (Gc), visual processing (Gv) and auditory processing (Ga). It also includes short-term memory (Gsm), long-term storage and retrieval (Glr), and processing speed (Gs). This is a selected summary of broad areas. The full taxonomy has changed over time, and newer accounts may use Gwm or separate learning from retrieval. These are the broad areas behind the phrase “seven g's of intelligence”.
Several WISC-V constructs have a rough match with CHC classes. Researchers have also tested CHC-related models of its scores. Its indices are score groups set by the publisher for that battery. Each needs its own evidence before comparison with scores from another test.
Not on its own. Cognitive tests may help answer some referral questions. Profile methods still have limits in reliability, agreement and value for treatment.
Diagnosis needs the right professional framework. It also needs direct evidence of attainment and impairment, context, development and qualified judgement.
No general rule for matching teaching to a learner's strongest CHC ability has sound support, so decisions need evidence about the actual skill, task and intervention. A strength may help form a qualified hypothesis. The practical test is whether teaching improves the skill the learner needs.
It is John Carroll's 1993 model of cognitive abilities. He reanalysed more than 460 data sets and grouped abilities into three levels: narrow abilities, eight broad abilities and a single general factor, g. It is the source of the pyramid often used to explain CHC.
Cattell and Horn's Gf-Gc theory began with fluid and crystallised abilities, then expanded to a set of broad factors at its highest level. Carroll's model places g above the broad factors. CHC is the later umbrella used to discuss these related traditions.
CHC groups cognitive abilities into narrow abilities, broad abilities and, in Carroll's version, a general factor called g. For a concise course answer, name these levels and distinguish Carroll's hierarchy from the earlier Cattell-Horn model.
CHC includes broad and narrow abilities, while g is the general factor above the broad abilities in Carroll's hierarchy. Horn's extended Gf-Gc model kept broad abilities at its highest level.
Brown, R. E. (2016). Hebb and Cattell: The genesis of the theory of fluid and crystallized intelligence. Frontiers in Human Neuroscience, 10, 606.
Burns, M. K., Petersen-Brown, S., Haegele, K., Rodriguez, M., Schmitt, B., Cooper, M., Clayton, K., Hutcheson, S., Conner, C., Hosp, J., & VanDerHeyden, A. M. (2016). Meta-analysis of academic interventions derived from neuropsychological data. School Psychology Quarterly, 31(1), 28-42.
Caemmerer, J. M., Keith, T. Z., & Reynolds, M. R. (2020). Beyond individual intelligence tests: Application of Cattell-Horn-Carroll theory. Intelligence, 79, 101433.
Carroll, J. B. (1993). Human cognitive abilities: A survey of factor-analytic studies. Cambridge University Press.
Cattell, R. B. (1963). Theory of fluid and crystallized intelligence: A critical experiment. Journal of Educational Psychology, 54(1), 1-22.
Decker, S. L., & Luedke, J. C. (2021). Evidence-based use of cognitive testing for academic interventions: A critical appraisal of meta-analytic methodologies. Frontiers in Education, 6, 637676.
Horn, J. L., & Cattell, R. B. (1966). Refinement and test of the theory of fluid and crystallized general intelligences. Journal of Educational Psychology, 57(5), 253-270.
Kulesz, P. A., Roberts, G. J., Francis, D. J., Cirino, P., Walczak, M., & Vaughn, S. (2024). Latent profiles as predictors of response to instruction for students with reading difficulties. Journal of Educational Psychology, 116(3), 363-376.
McGill, R. J., & Dombrowski, S. C. (2019). Critically reflecting on the origins, evolution, and impact of the Cattell-Horn-Carroll model. Applied Measurement in Education, 32(3), 216-231.
McGill, R. J., Dombrowski, S. C., & Canivez, G. L. (2018). Cognitive profile analysis in school psychology: History, issues, and continued concerns. Journal of School Psychology, 71, 108-121.
McGrew, K. S. (2009). CHC theory and the human cognitive abilities project: Standing on the shoulders of the giants of psychometric intelligence research. Intelligence, 37(1), 1-10.
McGrew, K. S. (2023). Carroll's three-stratum cognitive ability theory at 30 years. Journal of Intelligence, 11(2), 32.
Miciak, J., Fletcher, J. M., Stuebing, K. K., Vaughn, S., & Tolar, T. D. (2014). Patterns of cognitive strengths and weaknesses: Identification rates, agreement, and validity for learning disabilities identification. School Psychology Quarterly, 29(1), 21-37.
Miciak, J., Williams, J. L., Taylor, W. P., Cirino, P. T., Fletcher, J. M., & Vaughn, S. (2016). Do processing patterns of strengths and weaknesses predict differential treatment response? Journal of Educational Psychology, 108(6), 898-909.
Reynolds, M. R., Keith, T. Z., Flanagan, D. P., & Alfonso, V. C. (2013). A cross-battery, reference variable, confirmatory factor analytic investigation of the CHC taxonomy. Journal of School Psychology, 51(4), 535-555.
Stuebing, K. K., Barth, A. E., Molfese, P. J., Weiss, B., & Fletcher, J. M. (2009). IQ is not strongly related to response to reading instruction: A meta-analytic interpretation. Exceptional Children, 76(1), 31-51.
Stuebing, K. K., Barth, A. E., Trahan, L. H., Reddy, R. R., Miciak, J., & Fletcher, J. M. (2015). Are child cognitive characteristics strong predictors of responses to intervention? A meta-analysis. Review of Educational Research, 85(3), 395-429.
Watkins, M. W., Canivez, G. L., Dombrowski, S. C., McGill, R. J., Pritchard, A. E., Holingue, C. B., & Jacobson, L. A. (2022). Long-term stability of Wechsler Intelligence Scale for Children-fifth edition scores in a clinical sample. Applied Neuropsychology: Child, 11(3), 422-428.
Watrin, L., Schroeders, U., & Wilhelm, O. (2023). Gc at its boundaries: A cross-national investigation of declarative knowledge. Learning and Individual Differences, 102, 102267.
Wilson, C. J., Bowden, S. C., Byrne, L. K., Vannier, L.-C., Hernandez, A., & Weiss, L. G. (2023). Cross-national generalizability of WISC-V and CHC broad ability constructs across France, Spain, and the US. Journal of Intelligence, 11(8), 159.
Wilson, C. J., Bowden, S. C., Batty, A. M., Byrne, L. K., & Weiss, L. G. (2024). Factorial invariance of the Wechsler Intelligence Scale for Children, Fifth Edition, across the UK, US and Australia and New Zealand. British Journal of Clinical Psychology, 63(4), 603-626.
Flanagan and Dixon (2014). The Cattell-Horn-Carroll Theory of Cognitive Abilities.
Horn and Cattell (1967). Age differences in fluid and crystallized intelligence.
McArdle, Ferrer-Caja, Hamagami and Woodcock (2002). Comparative longitudinal structural analyses of the growth and decline of multiple intellectual abilities over the life span.
Hartshorne and Germine (2015). When Does Cognitive Functioning Peak? The Asynchronous Rise and Fall of Different Cognitive Abilities Across the Life Span.
Dombrowski, McGill and Morgan (2021). Monte Carlo Modeling of Contemporary Intelligence Test (IQ) Factor Structure: Implications for IQ Assessment, Interpretation, and Theory.
Cucina and Howardson (2017). Woodcock-Johnson-III, Kaufman Adolescent and Adult Intelligence Test (KAIT), Kaufman Assessment Battery for Children (KABC), and Differential Ability Scales (DAS) support Carroll but not Cattell-Horn.