AI Graphic Organisers: Visual Thinking Tools
Discover how AI graphic organisers and visual thinking tools reduce cognitive load, support learners with SEND, and bridge the gap to extended writing.

Discover how AI graphic organisers and visual thinking tools reduce cognitive load, support learners with SEND, and bridge the gap to extended writing.
AI Graphic Organisers: Visual Thinking Tools is a guide to using AI-generated graphic organisers, concept maps, mind maps and Venn diagrams in the classroom. These tools should support thinking, not provide finished answers. The evidence matters because visual structures can reduce unnecessary cognitive load. Even so, learning still depends on learners selecting, organising and integrating ideas for themselves (Fiorella & Mayer, 2015).
For example, a Year 8 science teacher might ask AI to turn a dense paragraph on photosynthesis into a labelled flowchart, then ask learners to challenge one arrow, add a missing cause and write a short explanation from the revised map. Used this way, the graphic organiser becomes a visual tool for reasoning, retrieval and extended writing rather than a polished diagram to copy.
AI graphic organisers interpret text and create visual representations. Teachers use them to transform lesson content into maps and charts. Learners find visual frameworks more engaging than worksheets. Use it as a starting point for professional discussion: identify the learner's current need, record evidence from more than one lesson, and agree the next classroom adjustment with the SENCO or family.
The primary function of these tools is not to do the thinking for the learner. AI should make relationships visible so learners can test them. A teacher might paste a difficult text into an AI tool, ask it to create a graphic organiser showing cause and effect, then ask learners to check the links, add missing evidence and explain one change. If you want a research-grounded structure for your lessons, start with research-based teaching frameworks.
Teachers can adapt resources to fit learner needs. AI helps create visual maps from one source. For advanced learners, the map uses academic vocabulary. For learners needing support, AI simplifies phrases and uses colour coding (Willingham, 2009).

Evidence overview
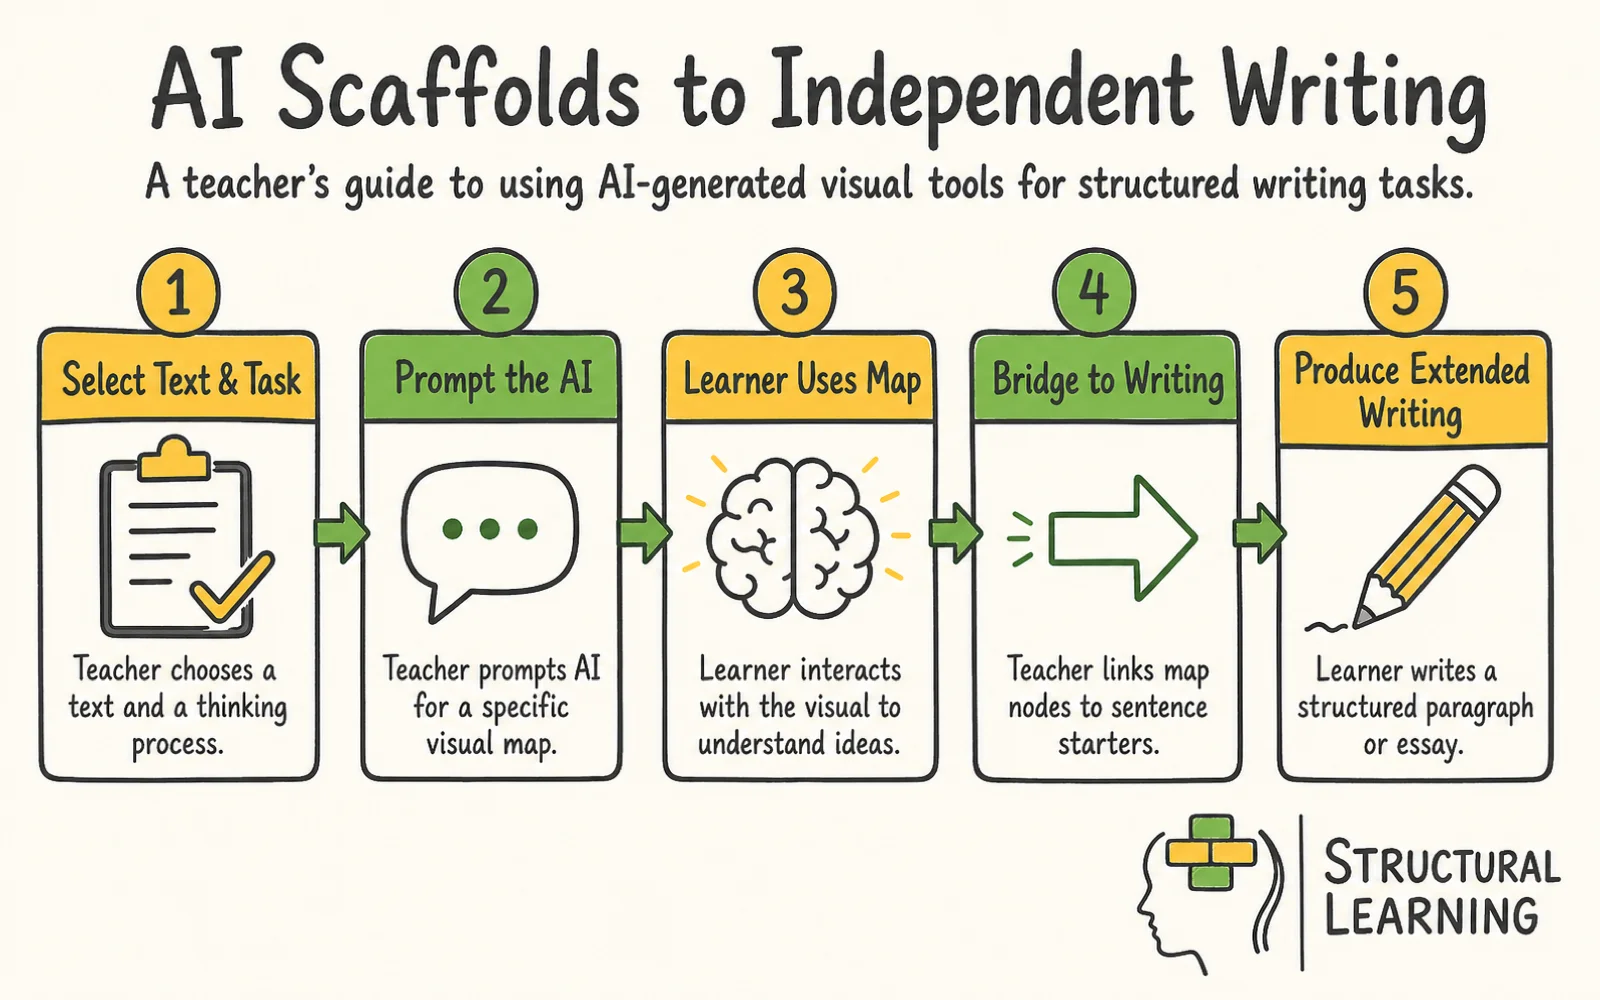
AI graphic organisers also bridge the gap between abstract thought and concrete writing. When a learner faces a blank page, it can be too hard to generate ideas and structure sentences at the same time. For more on this topic, see Mind maps for generating knowledge. A varied visual tool breaks the task into manageable steps.
The learner first works with the AI-generated visual nodes. They then use these nodes as building blocks to construct their final written response.
What the teacher does / what learners produce: The teacher inputs a complex scientific explanation of photosynthesis into an AI tool, prompting it to generate a flowchart. Learners then use this flowchart as a visual guide to write a paragraph explaining the process in their own words, using the nodes as prompts for each sentence.
Paivio's (1971) Dual Coding Theory explains how we process words and visuals. Brains use separate, linked channels for each. Combining text and diagrams, according to research, improves memory. AI transforms text into dual-coded diagrams, applying this instantly.
Sweller (1988) found that working memory is limited. It can handle only a few new things at once. Dense text adds extra load because learners have to link sentences in their heads. AI graphic organisers reduce this load by showing connections clearly.
Spatial layout matters before learners read, conveying meaning (Caviglioli, 2019). Hierarchy differs from sequence in layouts. Use AI tools carefully to get good spatial structures. Timelines in mind maps may cause cognitive conflict.
Visual frameworks are key for new learners. Novices lack schemas to organise information (Sweller, 1988). AI-created maps act as temporary support (Clark, 2008; Paivio, 2007). Learners use these to process information, building internal models (Mayer, 2009).
What the teacher does / what learners produce: The teacher presents a complex legal argument about a court case. The AI generates a visual map showing the different stages of the argument. Learners then use this map to summarise the key points, demonstrating their understanding of the legal process.
Teachers need to choose the type of thinking learners need to practise (Jonassen, 2000). Before using AI visual tools, set the instructional focus. This reflects Vygotsky's (1978) account of learning through targeted social and cultural scaffolding.
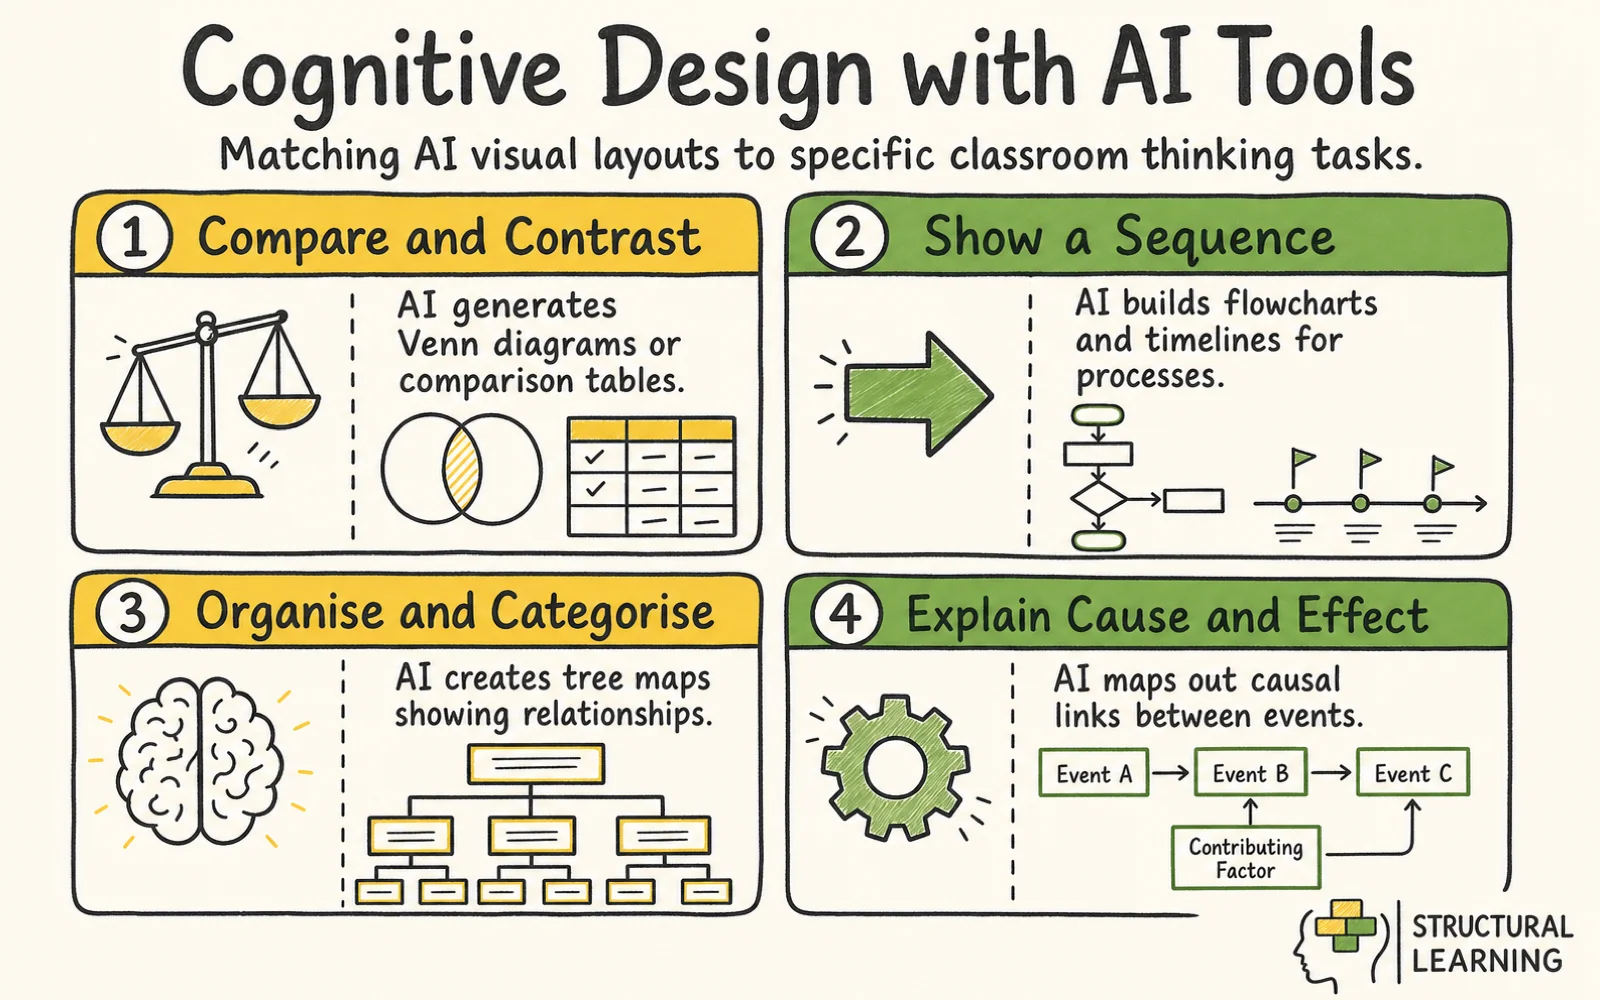
Different academic tasks require different cognitive actions. AI tools excel when the teacher explicitly names the required thinking process in the prompt. If the goal is classification, the prompt must direct the AI to generate a tree map or a Venn diagram.
Teacher action: The teacher inputs a dense text about renewable energy sources into an AI mapping tool. They prompt the tool with specific instructions: "Analyse this text and generate a tree diagram categorising the energy sources. Extract the main advantages and disadvantages for each node. Limit the text in each node to a maximum of six words."
Learner action: Learners receive the structured tree diagram. They use the categorised nodes to quickly compare solar and wind power without re-reading the original dense paragraphs. They add their own blank nodes to the diagram and fill them in with examples discussed during the lesson.
Teachers prompt AI; it makes a literary character comparison chart. Learners use the chart (Clark & Sampson, 2007) to structure their essays. This supports writing skills (Bereiter & Scardamalia, 1987).
Learners with additional needs often struggle with executive function, visual tracking and working memory. Poorly designed worksheets can increase that load. AI graphic organisers help teachers produce calmer versions of the same content, with larger spacing, fewer labels and clearer colour cues.
Teacher action: The teacher prepares a lesson on the causes of the First World War. For a learner with dyslexia who struggles with visual tracking, the teacher prompts the AI to modify the standard concept map. The prompt specifies that the AI must use a pastel background, increase the spacing between nodes, and apply a strict colour code where all economic causes are blue and all political causes are green.
Learners use the visual map, colour-coded for quick cause identification. Kirschner, Sweller and Clark (2006) argue that novice learners need explicit guidance, which helps explain why a clear visual scaffold can reduce search and layout demands. Learners spend less time decoding layout and more time reasoning about historical causes (Mayer & Moreno, 2003).
What the teacher does / what learners produce: The teacher uses the AI to generate a simplified timeline of historical events with larger font sizes and increased spacing. Learners with visual impairments then use this timeline to understand the sequence of events.
The ultimate goal of using a visual scaffold is usually extended writing. Graphic organisers can become a trap if learners simply fill in boxes and stop there. Teachers must use the AI tool to build a deliberate bridge between the visual nodes and the final paragraph.
Teacher action: The teacher uses an AI tool to generate a sequencing map showing the water cycle. Once the learners have reviewed the map, the teacher prompts the AI to generate targeted sentence starters corresponding to each specific node on the map. The teacher displays these sentence starters alongside the visual diagram.
Learners trace the visual map sequence (Park, 2016). They pick a point, read the sentence starter, and finish it using the vocabulary. Learners repeat this, moving across the map, building a full paragraph (Armellini & Jones, 2008). This explains the cycle clearly (Eppler, 2006).
What the teacher does / what learners produce: The teacher uses the AI to generate a mind map of key themes in a novel, then prompts the AI to create a series of questions related to each theme. Learners use the mind map and the questions to plan and write an analytical essay.
Research by Carney and Levin (2002) suggests educators may misunderstand visual aids. This can reduce how well learners use them in class. Dwyer (1978) and Moore and Dwyer (1994) highlight the need for accurate understanding.
The strongest misconception is that a polished AI map improves learning on its own. Fiorella and Mayer (2015) point to a different conclusion: learners build understanding when they select, organise and integrate ideas themselves. Treat the AI version as a draft to critique. Ask learners to challenge one link, add missing evidence, remove a weak node and explain why the revised graphic organiser is stronger.
Graphic organisers aren't just for younger learners. Key Stage 4 and A-Level learners benefit from visual structures as content gets harder. They can use tools to map arguments (Novak, 1998) or history (Ausubel, 1968). Visuals clarify complexity at all levels (Winn, 1991).
Teachers often assume that any visual diagram will work for any task. This can lead to too many basic spider diagrams. A generic mind map does not work well for a step-by-step process or a strict hierarchy.
The visual structure must match the cognitive function. If the task is comparison, the teacher must generate a double-bubble map or a Venn diagram.
Graphic organisers should support, not conclude, lessons. They help the learner write independently or explain ideas, (Bromley et al., 1995). Ending a lesson after box-filling wastes the tool's teaching potential, (Fisher & Frey, 2008).
Teachers can challenge misconceptions about graphic organisers, as suggested by Clarke (2018). Use AI concept maps to explore Shakespeare themes with A-level learners. Learners can then use the map to write essays, following research by Jones (2022).
Researchers found that different subjects need unique AI visual tools (Jisc, 2023). Concrete examples show how AI visual tools work across classrooms. Consider these when planning with learners. Use it as a starting point for professional discussion: identify the learner's current need, record evidence from more than one lesson, and agree the next classroom adjustment with the SENCO or family.
Task: Breaking down a complex GCSE essay prompt regarding the theme of ambition in Macbeth.
Teacher action: The teacher recognises that the multi-part essay question will cause working memory overload for several learners. The teacher pastes the essay prompt and an exemplar paragraph into an AI mind-mapping tool. The teacher prompts the AI to break the essay into three core arguments, assign a distinct colour to each argument, and provide two short textual quotes for each node.
Learner action: The learner receives the digitally structured map. Instead of facing a blank page, they see three clear, colour-coded pathways. The learner selects the first blue node, reads the provided quote, and uses a provided sentence starter to draft their first analytical paragraph. The visual chunking prevents them from feeling overwhelmed by the scale of the entire essay.
What the teacher does / what learners produce: The teacher uses the AI to generate a visual representation of the plot structure of a novel, highlighting key turning points and character relationships. Learners then use this map to write a detailed summary of the novel.
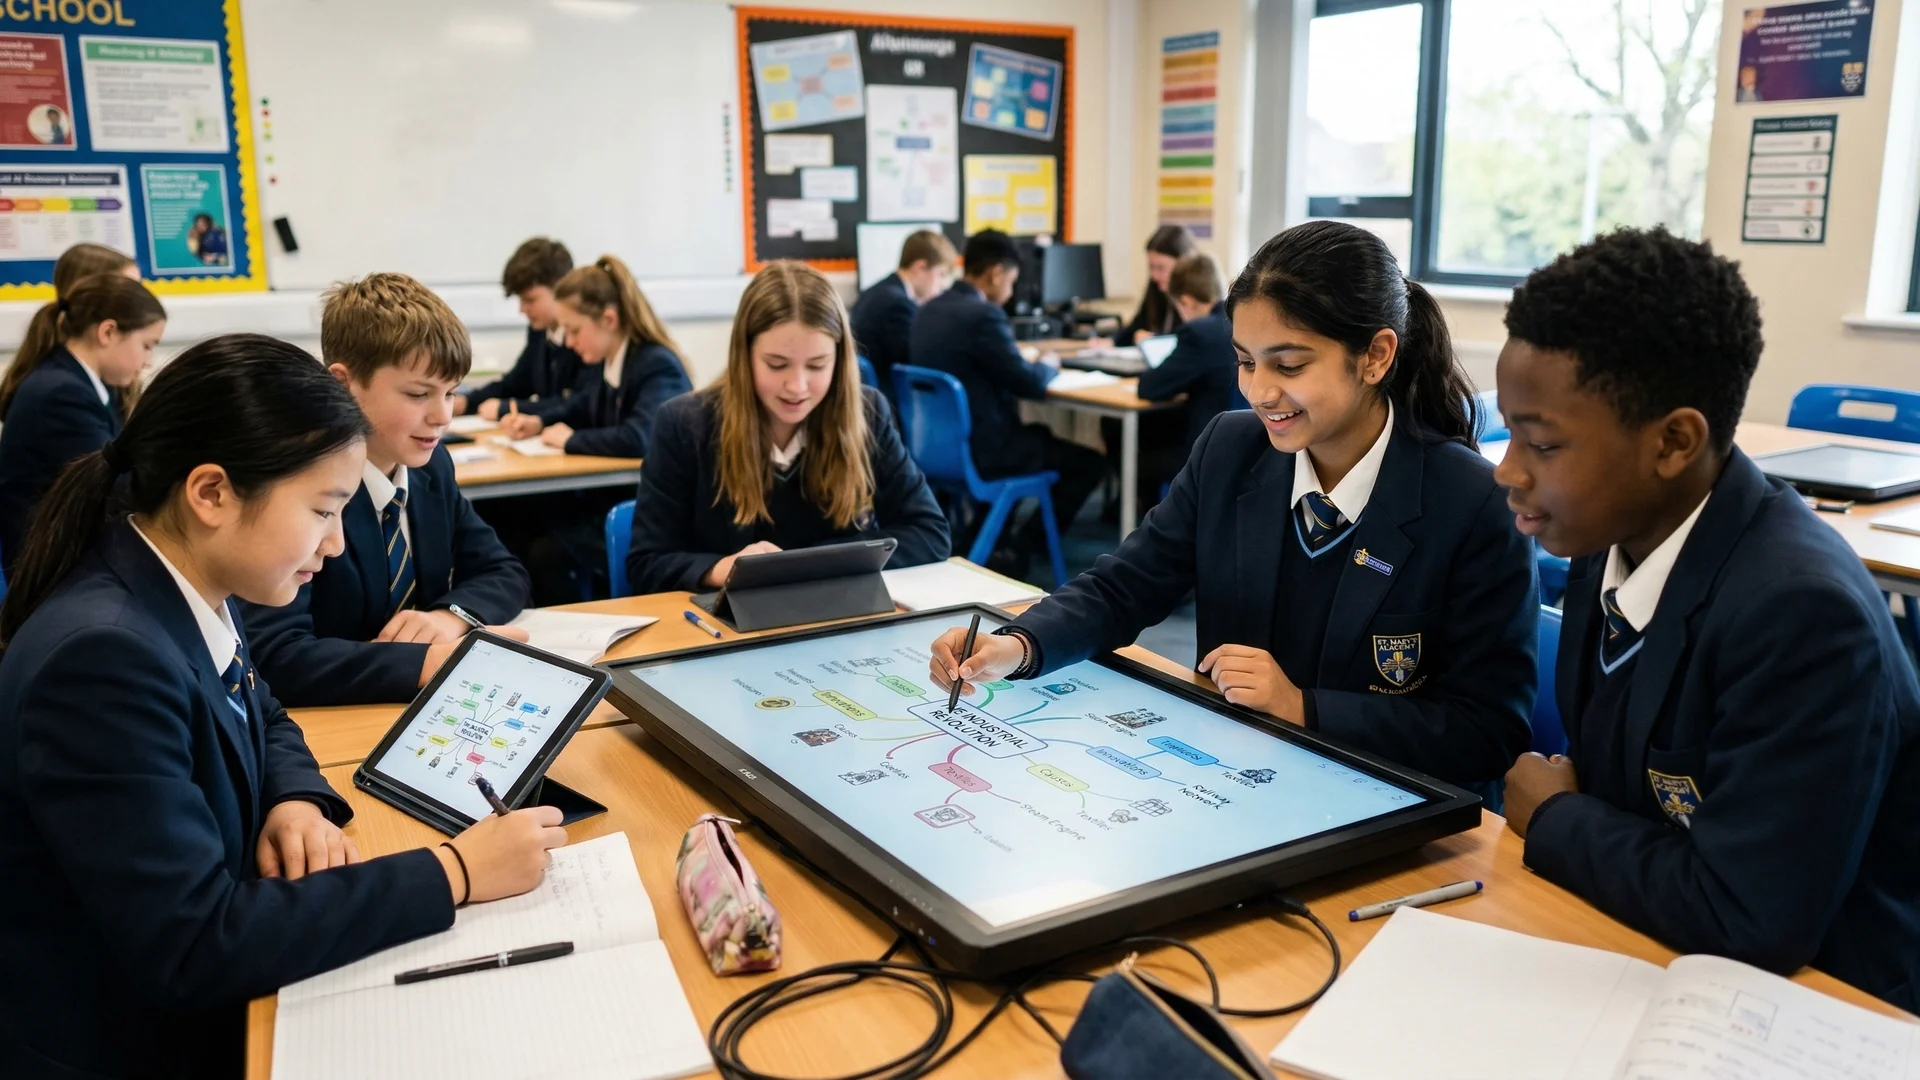
Task: Understanding the overlapping events of the Industrial Revolution.
Teachers use AI tools for interactive timelines. They ask AI to plot key inventions. The AI changes text complexity at each point. One timeline uses complex words; the other simplifies text for learners (Lai et al., 2023).
Learners use timelines matched to their reading levels. They click nodes to see simpler text. Learners then rank inventions by economic impact below the timeline. They use AI visuals to justify choices in a class debate (Laurillard, 2002; Kirschner, 2009).
What the teacher does / what learners produce: The teacher uses the AI to create a cause-and-effect diagram showing the factors that led to World War I. Learners then use this diagram to write an essay explaining the complex web of causes.
Task: Comparing and contrasting the structures of plant and animal cells.
Teacher action: The teacher prompts an AI tool to create a specific double-bubble map structure. The prompt dictates that the central shared nodes must contain the organelles common to both cells, while the outer distinct nodes must list the unique features. The teacher also directs the AI to generate targeted sentence starters at the bottom of the map for learners who struggle with task initiation.
Learners use a double-bubble map and trace lines to link common organelles. AI provides sentence starters, helping learners write comparisons like, "Both cell types contain a nucleus" (Fisher, 2023). This layout guides sentence structure.
What the teacher does / what learners produce: The teacher uses the AI to generate a visual model of the human digestive system, labelling each organ and its function. Learners then use this model to explain the process of digestion.
Task: Solving multi-step algebraic equations.
Teacher action: Word problems combined with algebra often overload working memory. The teacher inputs a complex word problem into an AI flowchart generator. The teacher prompts the AI to break the problem down into a strict, four-step vertical sequence. The AI isolates the numbers, identifies the required operation at each step, and creates a clean, linear pathway.
Learner action: The learner uses the flowchart as a step-by-step diagnostic tool. They follow the vertical path, performing the calculation required at node one before moving down to node two. The visual isolation of each step prevents the learner from combining numbers incorrectly or losing their place in the sequence of the equation.
What the teacher does / what learners produce: The teacher uses the AI to generate a visual representation of a geometric problem, highlighting key angles and measurements. Learners then use this diagram to solve the problem.
Researchers (Clark, 2019; Jones, 2022) say link AI tools to learning aims. This helps learners understand graphic organisers' purpose. Discuss how these tools boost knowledge. Review Blooms Taxonomy to improve lesson design (Anderson & Krathwohl, 2001).
The Universal Thinking Framework helps match visual tools to thinking. It sorts thinking into actions like define, compare, sequence, and evaluate. AI tools work well when teachers use these verbs in prompts. For example, asking AI to "sequence" produces better visuals than "summarise".
Schema Theory shows how brains connect knowledge (Bartlett, 1932). New learners’ schemas are basic, so they need clear structures to work with (Anderson, 1977). AI organisers give learners a visual schema on screen. By using these maps, learners internalise the structures and build detailed subject knowledge (Rumelhart, 1980; Schank & Abelson, 1977).
The Zone of Proximal Development (Vygotsky, 1978) highlights the importance of targeted scaffolding. A learner can achieve more with structured guidance than they can alone. AI visual tools can act as a responsive scaffold.
At the start of a topic, a teacher can use AI to give strong visual support. The AI can generate maps with detailed text and clear pathways. As the learner builds competence, the teacher can ask the AI for sparser maps. This fades the scaffold until the learner can work independently.
Wittrock (1974) showed that generative learning needs active thought. Learners choose key information, organise it, and link it to prior knowledge. AI graphic organisers can support this active organisation. Learners adapt the AI maps, make connections, and write about the structures.
Teachers link AI mind maps to schema building, explaining organisation and memory. Learners then create mind maps on new topics. This shows their grasp of schema theory. (Anderson, 1977; Bartlett, 1932; Piaget, 1952).
Free for teachers. The platform builds a classroom-ready lesson plan from your topic in under two minutes.
How do I stop learners from just copying the AI-generated map without thinking? Use it as a starting point for professional discussion: identify the learner's current need, record evidence from more than one lesson, and agree the next classroom adjustment with the SENCO or family.
The visual map must never be the final task. Always attach a transformational activity to the map. If the AI provides a sequenced flowchart, the learner must use that flowchart to write an explanatory paragraph without looking back at the original text. The map is the starting line, not the finish line.
Which specific visual structure should I ask the AI to build?
The structure must match the verb of your learning objective. If the objective is to compare, ask for a Venn diagram or a double-bubble map. If the objective is to show a timeline, ask for a chronological flowchart. If the objective is categorisation, ask for a hierarchical tree map.
Can these tools really help learners with severe working memory issues?
Yes, structured visual tools act as an external hard drive for working memory. By parking complex information in a clear, colour-coded visual format, the learner frees up cognitive capacity. They no longer have to hold all the variables in their head at once, allowing them to focus their mental energy on analysis and writing.
Is generating these visual tools time-consuming for the teacher?
Traditional creation of graphic organisers in word processors was slow. AI tools change this completely. A teacher can paste a large block of text into an AI generator and ask the tool to create a graphic organiser in seconds. The time investment shifts from drawing boxes to choosing the right thinking process, checking the output and preparing the follow-up task.
How do I transition learners away from relying on these visual scaffolds?
Scaffolding must be faded deliberately. In week one, provide the completed AI-generated map. In week two, provide a partly completed map where learners fill in the blank nodes. In week three, provide only the blank spatial structure.
By week four, the learner should be able to sketch their own rough visual map on a whiteboard. They can do this before they begin writing.
What the teacher does / what learners produce: The teacher models the process of gradually fading the visual scaffold, showing learners how to move from relying on the AI-generated map to creating their own visual representations. Learners then practice this skill with different topics.
Need action for the next lesson? Choose one complex text explanation. Use AI to turn it into a tree map.
This fits Hattie's (2009) focus on making learning visible and Marzano's (2004) work on non-linguistic representation. Tree maps support understanding (Robinson, 1998; Clarke, 2005).
AI graphic organisers have a clear classroom use, but the evidence base is indirect. Much of the argument comes from dual coding, cognitive load theory, concept mapping and generative learning, not from trials of AI-generated graphic organiser tools. Fiorella and Mayer (2015) warn that learning improves when learners select, organise and integrate ideas themselves. A polished AI map can create fluency without understanding if learners only view it.
A second criticism concerns retrieval and observable performance. Karpicke (2008) shows that durable learning depends on learners bringing knowledge back to mind, not recognising a neat diagram. Watson (1913), from a different tradition, would also push us to look at what learners actually do. A completed Venn diagram or concept map is a product, not proof that a learner can explain, transfer or retrieve the knowledge unaided.
There are also design, cultural and methodological limits. Sweller, Ayres and Kalyuga (2011) warn that crowded labels, arrows and colour codes can increase extraneous cognitive load. Many visual templates assume linear hierarchy, which may not fit learners who use more relational, oral or community-based ways of organising knowledge; Yunkaporta (2009) and Milton (2012) both question dominant categories that marginalise other ways of thinking. Used critically, AI graphic organisers still have enduring value because they make thinking visible while leaving the intellectual work with the learner.
Authoritative guidance on AI in education: DfE guidance on generative AI in education, DfE support materials for using AI in education settings, Ofsted findings from AI early adopters in schools and FE, EEF Teacher Choices trial on ChatGPT in lesson preparation.
The studies below set out the evidence base for graphic organisers, concept mapping and dual coding, and look at how generative AI is starting to shape these visual tools in real classrooms. Each links to the original journal.
Graphic organizers and students with learning disabilities: a meta-analysis View study ↗
Dexter, D. D. & Hughes, C. A. (2011)
A meta-analysis of 16 studies covering 808 learners with learning disabilities across grades 4 to 12. Using graphic organisers was linked to gains in vocabulary, comprehension and inferential knowledge, with effects ranging from moderate to large depending on the type of organiser and subject. Useful evidence that well-chosen organisers help the learners who most need structure.
Do you get the picture? A meta-analysis of the effect of graphics on reading comprehension View study ↗
Guo, D., Zhang, S., Wright, K. L. & McTigue, E. M. (2020)
Across 39 experimental studies, adding graphics to text had a moderate positive effect on reading comprehension (g = 0.39), regardless of year group. The review also shows that graphics help more on open-ended tasks than on simple true/false items, a useful reminder that the design and purpose of a visual matter as much as its presence.
The effectiveness of concept maps on students' achievement in science: a meta-analysis View study ↗
Anastasiou, D., Wirngo, T. A. & Bagos, P. G. (2024)
A synthesis of 55 studies with 5,364 learners in grades 3 to 12 found a moderate-to-large effect of concept mapping on science achievement (g = 0.78). The benefit was strongest when learners built their own maps rather than copying ready-made ones, which is a key design principle for any AI-assisted organiser.
For whom is a picture worth a thousand words? Extensions of a dual-coding theory of multimedia learning View study ↗
Mayer, R. E. & Sims, V. K. (1994)
A foundational test of dual coding: pairing words and pictures so they are processed together helped learners transfer ideas to new problems, especially those with stronger spatial ability. It explains why graphic organisers work, by giving learners both a verbal and a visual route into the same idea.
The effects of generative AI agents and scaffolding on enhancing students' comprehension of visual learning analytics View study ↗
Yan, L., Martinez-Maldonado, R., Jin, Y., Echeverria, V., Milesi, M., Fan, J. et al. (2025)
A randomised controlled trial with 117 higher-education learners found that proactive generative-AI agents, which ask scaffolding questions, improved comprehension of visual material more than passive agents or scaffolding alone, with effects that lasted beyond the session. Early evidence that how an AI tool prompts thinking matters more than the tool itself.
Dual-coded. Print-ready. Free for teachers.
Open a free account and help organise learners' thinking with evidence-based graphic organisers. Reduce cognitive load and guide schema building dynamically.