Star Assessments: A Teacher's Guide to Renaissance
Star Reading, Maths and Early Literacy use computer-adaptive testing. Turn scaled scores and percentiles into decisions about progress and intervention.


Star Reading, Maths and Early Literacy use computer-adaptive testing. Turn scaled scores and percentiles into decisions about progress and intervention.
If you use Renaissance Star Reading, Star Maths, or Star Early Literacy in your school, you already know how quickly these computer-adaptive tests pinpoint where students are struggling. What you might not know is how to translate those data points into actual classroom decisions. A reading scale score of 728L feels meaningful until you realise your Year 4 class has scores ranging from 450L to 900L and no clear way to match books to readers. Similarly, a Star Maths percentile rank can tell you who's behind but not why, or what intervention might close the gap. This guide moves beyond the numbers and shows you how to interpret Star data in ways that actually change what happens in your classroom.
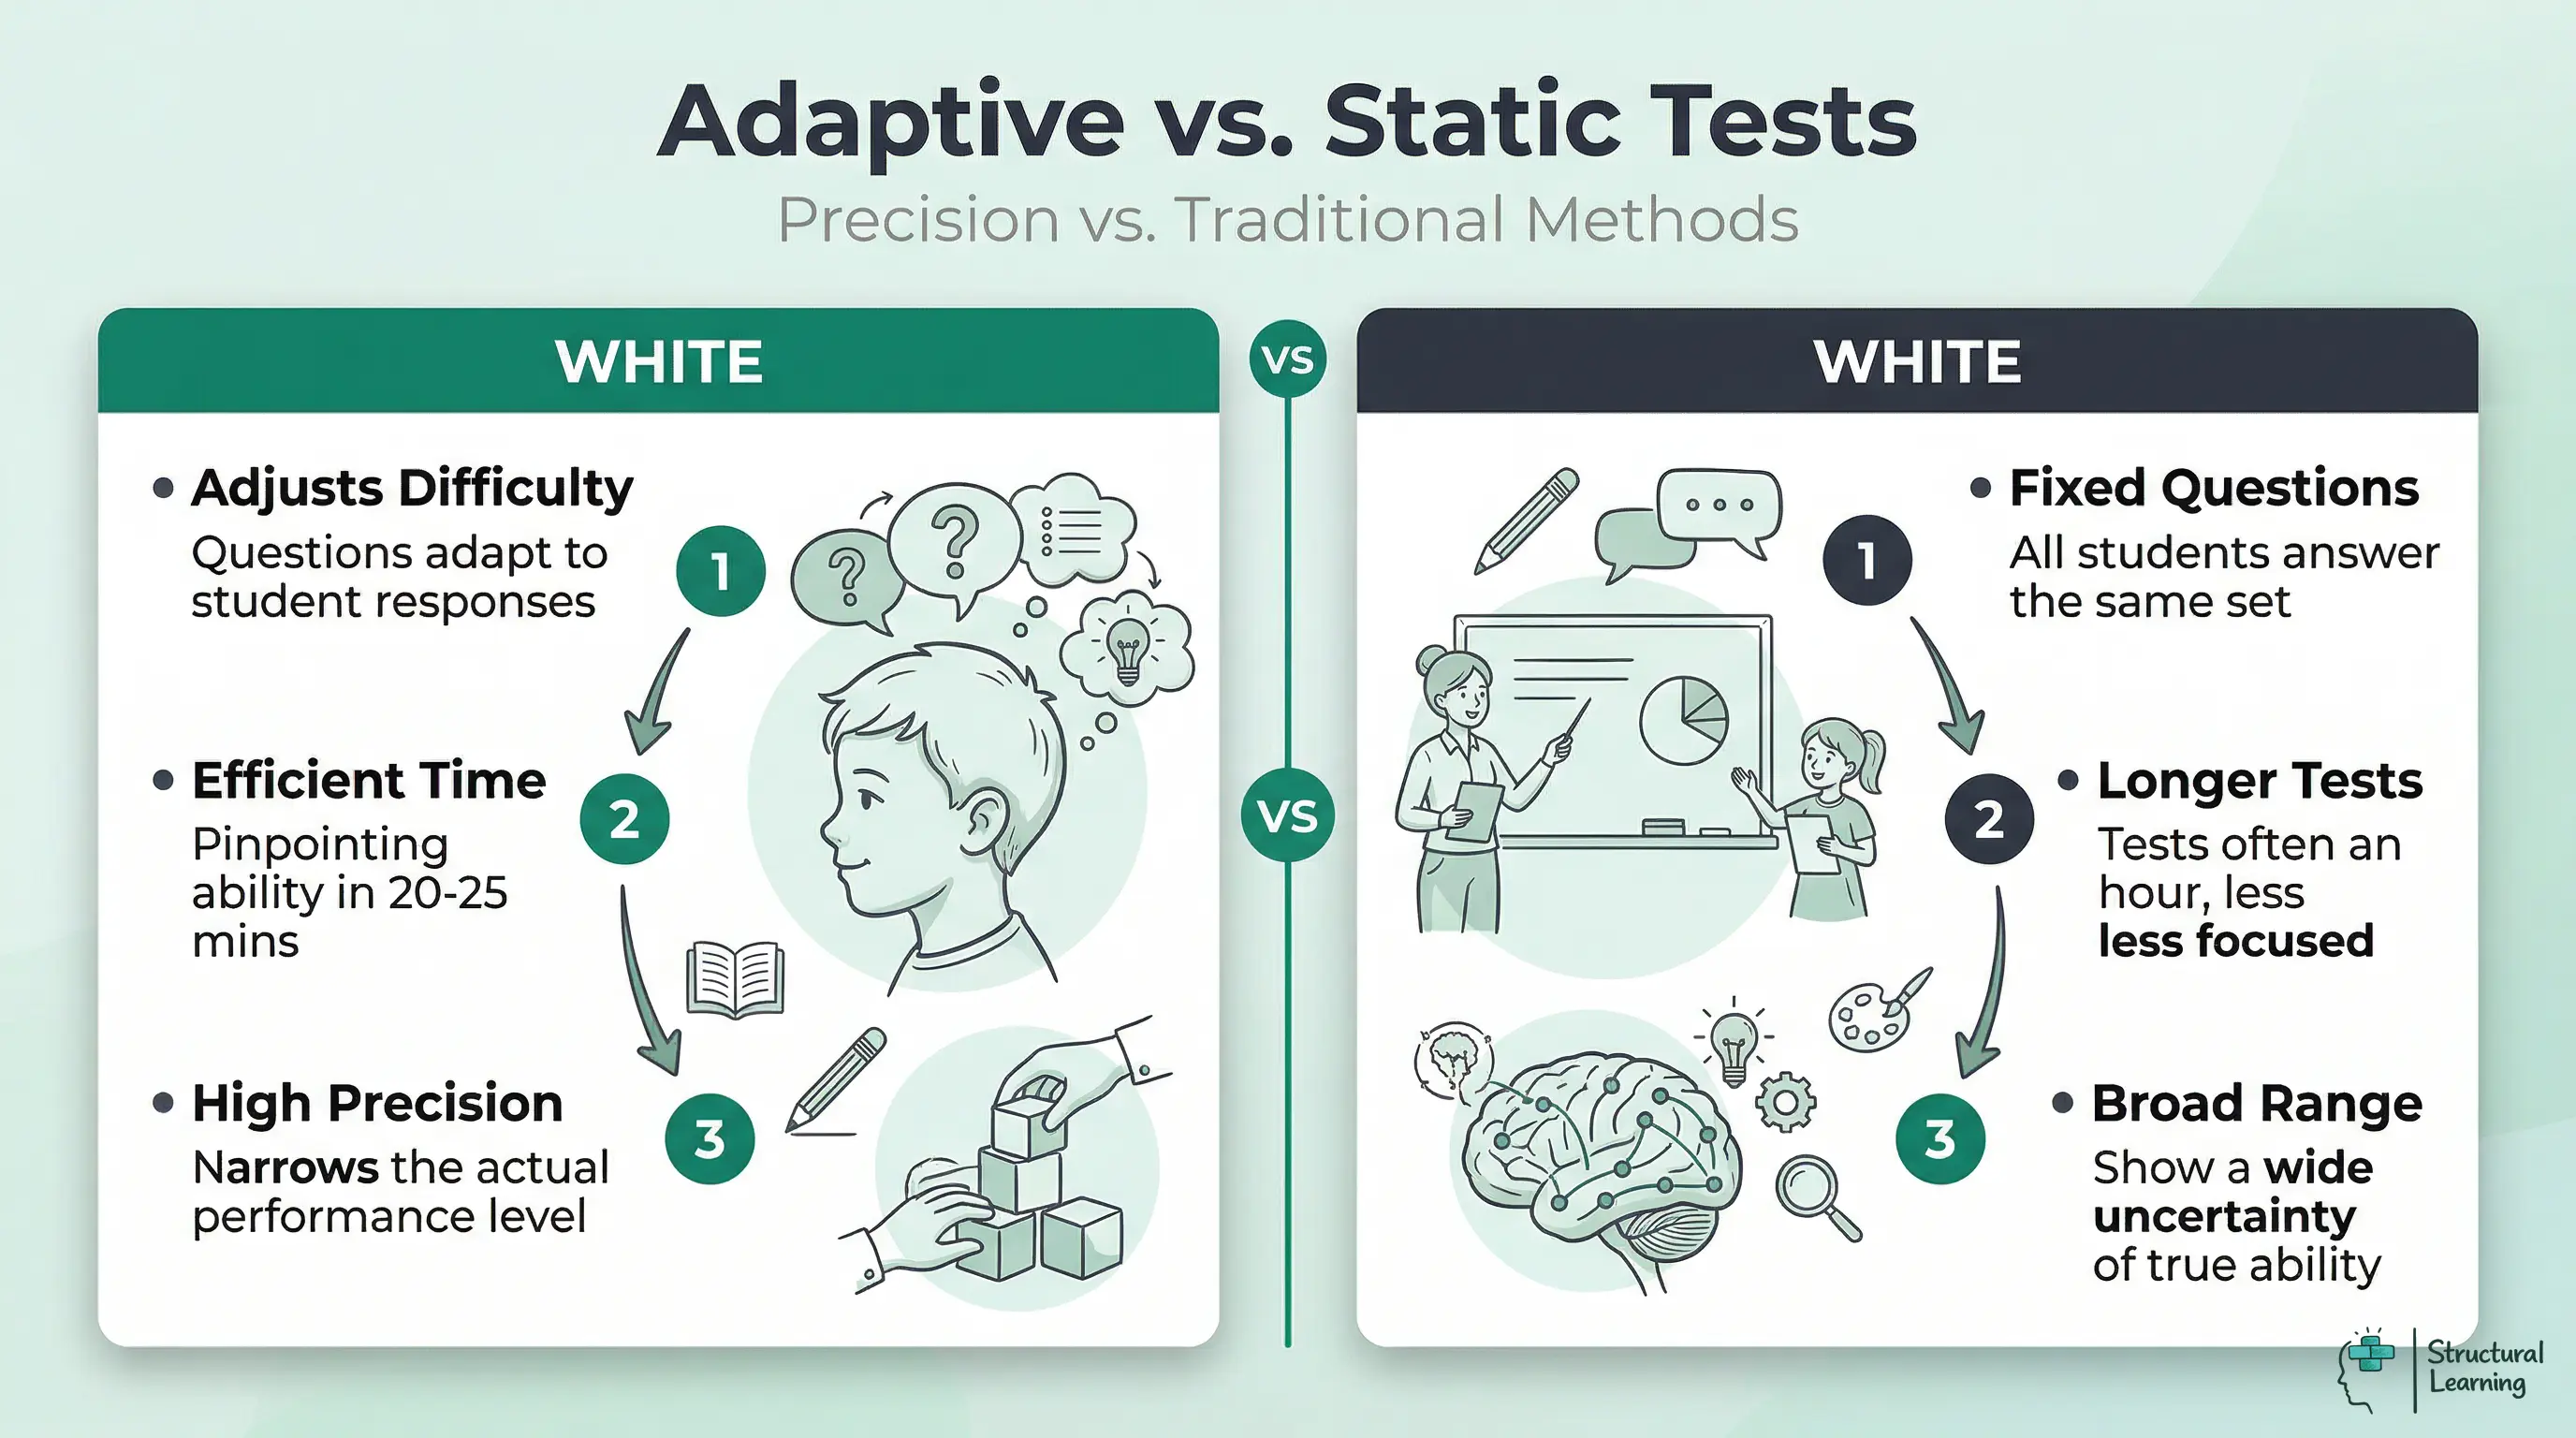
Star Assessments use computer-adaptive testing (CAT) to measure reading and mathematics achievement. Instead of every student answering the same questions in order, the computer adjusts question difficulty based on each student's responses. Get one right, the next one gets harder. Get one wrong, it gets easier. This active adjustment happens in real time, which means Star finishes measuring students in about 20-25 minutes instead of the hour-long paper tests schools used to rely on.
The power of adaptive testing lies in precision. A traditional test gives every student a fixed set of items; it wastes time on questions that are too easy or too hard, and it leaves wide uncertainty about where a student's true ability sits. Computer-adaptive testing homes in on each student's actual performance level within a narrow band, then stops. Renaissance Learning engineers this by calculating a measure called the Rasch scale, named after the measurement theorist Georg Rasch. The Rasch model converts raw test scores (number of items correct) into equal-interval scales where the distance between 600 and 610 represents the same increase in difficulty as the distance between 700 and 710. This matters because it makes scores from different test forms directly comparable, even if the questions are different.
Here's a Year 3 example. You give your class the Star Reading benchmark in October. Aisha finishes after 22 questions and gets a scale score of 634L. Ethan takes 18 questions and scores 541L. The L denotes Lexile Framework, which Renaissance uses to map reading difficulty onto a universal scale (explained below). The computer stopped asking Ethan harder questions because his performance suggested he wasn't ready; it kept asking Aisha progressively harder questions because she showed she could handle them. Both assessments took about 20 minutes. A traditional test would have given them both 40 or 50 items, half of which would have been too easy for Aisha and too hard for Ethan.
One critical point: computer-adaptive tests measure what a student can do on the day they sit the test, under exam conditions, with technology they may or may not be familiar with. They do not measure reading fluency, reading behaviours, or comprehension strategies a student uses flexibly in real classroom reading. This distinction matters enormously and will matter more when you compare Star scores to your own classroom observations, which we address in detail in section six.
Renaissance Learning offers three products, each targeted at a different age phase and skill domain. Understanding what each one actually measures prevents the mistake of treating reading scale scores as gospel truth about student ability.
Star Reading assesses reading from early years to secondary. Test format varies by age. Younger learners read passages with multiple-choice questions. Older learners read harder texts with inference questions. The score is a Lexile measure, like 300L. This shows text difficulty. A learner scoring 300L should understand similar texts with 75% accuracy. This benchmark is for "stretch" reading. The scale ranges from below 0L to 1400L+ (Renaissance).
Star Maths measures mathematics achievement across procedural fluency, conceptual understanding, and problem-solving. Unlike reading, which adapts across text types and genres, Star Maths adapts across mathematical domains: a student might start with addition, shift to geometry if they show strength there, then move into algebraic thinking. The scale is different from Lexile; it's a Rasch-based scale ranging from roughly 0 to 1400, where higher numbers indicate greater mathematical sophistication. A student with a Star Maths scale score of 545 might show strong computation but weaker reasoning; a student with 680 might handle multi-step problems and applied contexts. Star Maths also assesses growth, so schools often run it three times a year (autumn, spring, summer benchmarks) to measure trajectory.
Star Early Literacy assesses reading skills in learners aged 4-6. It measures letter recognition and phonemic awareness. The test also looks at sight words and decoding. The scale ranges from 0 to 400. Animated characters and short response times suit young learners. Renaissance data starts here, with transition to Star Reading later.
A Year 2 class example: Your reception cohort did Star Early Literacy in June 2024. Average scale score was 187, which suggests most children are secure with letter naming and initial sound recognition but not yet blending consistently. In September 2024, after summer small-group phonics work, you run it again. The cohort average jumps to 224. You promote 15 children to Star Reading for autumn half-term baseline; five remain on Early Literacy with targeted phonological awareness support. The children promoted to Star Reading average 420L, suggesting they can read simple CVC words and very short captions independently.
Star reports give you three different ways to interpret performance: scaled scores, percentile ranks, and grade equivalents. Each one answers a different question and each one can mislead you if you misread it.

The scaled score is the Rasch-adjusted measure that makes the CAT magic work. For Star Reading, it's the Lexile (the number with the L). For Star Maths, it's a 0-1400 scale. Scaled scores are equal-interval, which means they're the only measure you should use when tracking growth or calculating class averages. If half your class gains 50 Lexile points and the other half gains 30, the average growth is 40 points, not "we made mixed progress." The minute you start averaging percentile ranks or grade equivalents, your maths breaks down because those scales are not equal-interval.
Percentile rank tells you where a student sits relative to a reference group, usually national norms or your school's own cohort. A student at the 75th percentile scored higher than 75 per cent of students in that reference group. Percentile rank is intuitive for talking to parents ("your daughter is in the top quarter of her year group") and useful for flagging students who are falling significantly behind peers. But percentile rank obscures growth. A student might jump from the 40th to the 50th percentile and appear to have made modest progress; in reality, if there was cohort compression at the lower end of the scale, that jump could represent significant growth in absolute terms. Always look at scaled score growth alongside percentile rank change.
Grade equivalents are the riskiest number to use without context. A grade equivalent of 5.2 means "this student performed at the same level as a typical student in the fifth grade, second month." It sounds precise; in reality, it's an interpolation. Renaissance didn't necessarily test actual Grade 5 students in February; they used statistical modelling to extrapolate where Grade 5 performance would sit. Grade equivalents also create a false sense of curriculum alignment. A student with a grade equivalent of 6.5 in Star Reading is not necessarily "ready for Year 7 curriculum"; they've simply reached a point on the Lexile scale where a typical Year 7 student would sit, and Year 7 English curricula vary enormously across schools.
Here's how to avoid these pitfalls in practice. Your Year 5 class takes Star Reading in October (autumn benchmark). The report shows:
Many teachers look at Khalid's grade equivalent and assume he's "nearly a year behind." In fact, Khalid is about 70 Lexile points behind Taran, which is meaningful but not insurmountable (roughly equivalent to the difference between early Year 5 texts and mid-Year 4 texts). The grade equivalent obscures this reality. In January (spring benchmark), you run the test again:
Khalid made nearly twice the growth of Taran. But if you looked only at grade equivalents, you might miss this progress because the jump from 4.9 to 5.3 doesn't sound as dramatic as it is. Use scaled scores to track growth and percentile rank to flag cohort-level concerns; use grade equivalents only for parent conversation, and always explain what they do and do not mean.
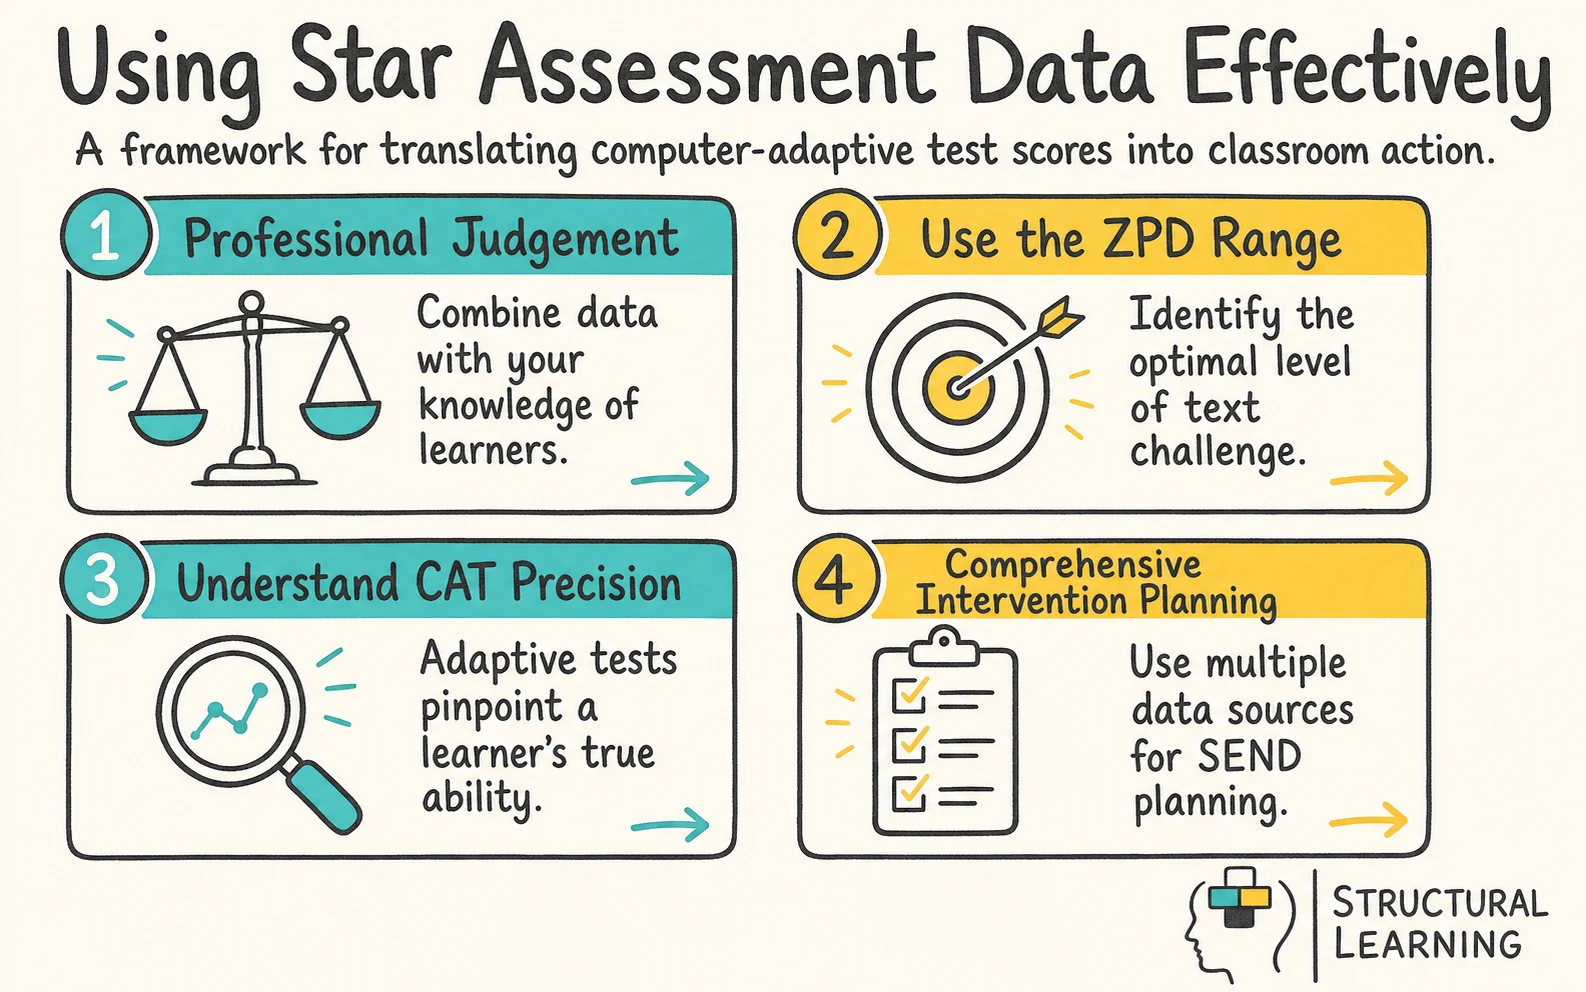
Lev Vygotsky's concept of the Zone of Proximal Development (ZPD) is perhaps the single most useful lens through which to interpret Star Reading data. The ZPD is the gap between what a child can do independently and what they can do with skilled support. Reading that falls in the ZPD is neither too easy (no growth) nor too hard (overwhelming); it's the sweet spot where a reader stretches slightly and makes progress with scaffolding.
Vygotsky's theory is a useful classroom lens, but the Lexile range should be treated as a starting point rather than a guarantee of growth. MetaMetrics describes Lexile measures as a way to place reader ability and text difficulty on the same scale, with appropriately matched texts expected to be challenging but manageable. A student with a Star Reading score around 650L may start with texts in that broad band, then the teacher should adjust for background knowledge, interest, stamina and classroom evidence.
This is where Star Reading becomes genuinely useful in classroom selection. If your library is levelled by Lexile (and increasingly many schools' libraries are, either natively or via third-party systems like Beanstack), you can pull books with precision. Your Year 3 class has a wide range of readers. Fatima has a Star Reading score of 480L; you put her in the 480-530L range. Marcus is at 720L; he reads from the 720-770L range. Everyone is reading age-appropriate content at their actual level, not your guess at their level.
The catch: Lexile levels are reliable measures of text difficulty but not of text interest or relevance. A book might be lexically at 520L but narratively uninspiring for your class. Conversely, a book at 580L might be so engaging that a student at 480L will push through the vocabulary challenge. This is where your professional judgment and formative assessment come in. Star gives you the starting point; your knowledge of your students' reading behaviours, interests, and resilience and growth mindset shapes the final selection.
One more critical nuance: the Star Reading Lexile is a measure of reading difficulty as determined by sentence length, word frequency, and semantic complexity. It does not account for background knowledge. A Year 4 reader with a 650L score can decode and process a 650L text, but if that text is about quantum physics and the reader has never encountered the concept, comprehension breaks down. The reader's background knowledge, prior vocabulary, and domain experience all create a secondary "zone." An effective library has Lexile variety within domains: multiple options at each Lexile level covering different genres and topics so readers can find texts that match both their reading level and their background knowledge.
Schools often report Star Reading in two ways: attainment (where students are right now) and growth (how much they've progressed). This distinction is crucial because a school can look flat on attainment but be doing extraordinary work on growth, and vice versa.
Attainment is a snapshot: "In October, the year group's average Star Reading score was 620L." It tells you where students sit on the absolute scale. You compare attainment across classes, across year groups, and across years. It answers the question "are our Year 3 cohort now stronger readers than last year's Year 3 cohort?" and "is our lowest-attaining group getting farther behind?"
Growth is the change from one benchmark to the next: "Students gained an average of 35 Lexile points between autumn and spring." It tells you the rate of progress. Compare growth against the current norms and reports for the specific Star assessment your school uses, then ask whether the pattern also appears in classroom reading, intervention records and recent work. A low-growth group may need closer reading instruction review; a high-growth group still needs item-level and classroom evidence before you change provision.
The reason both matter is this: a school with high starting attainment but low growth is potentially coasting. A school with lower attainment but strong growth is making real progress with their students. A school with high attainment and strong growth is clearly doing strong work. A school with low attainment and low growth is in crisis mode.
In practice, here's how to interpret dual reports. In September, your Year 4 attainment (based on spring Year 3 scores) was 568L (class average). This was below the national average of 580L for Year 4. Over autumn to spring, your class grew from 568L to 603L, a gain of 35 points. Your growth rate exceeded national norms (which expect 15-25 points for Year 4). In the absolute sense, you're still below national average attainment. But you're closing the gap and doing it faster than expected. This tells you your reading instruction is working; you simply inherited a cohort that started slightly behind, and you're accelerating them to match peers.
Dylan Wiliam's research on formative assessment emphasises that growth data is more actionable for teachers than attainment data alone. Attainment tells you which students need support; growth tells you whether your support is actually working. If you're running Star benchmarks three times a year, you have a mid-year checkpoint. If autumn-to-spring growth was weak for a particular group, you have a chance to shift intervention approach before the summer. This is why some schools run autumn benchmark, then spring, then summer, staggered across different year groups so teachers have time to act on results rather than just report them.
You trust your observations. You've watched Isla read aloud, discuss ideas, and self-correct mid-sentence. Her reading behaviours scream sophistication. But her Star Reading score is 610L, well below the school average of 650L for her year group. Or the opposite: Dev's Star Maths score is 680, suggesting he's strong with reasoning and applied problems. But in your classroom he freezes on multi-step problems and avoids asking for help.
Dissonance is normal. Star assesses learners' performance in timed tests (Star, n.d.). Classroom observations show behaviours, motivation, and progress (Wiliam, 2011). Both assessments offer truthful insights; they just show different aspects (Hattie, 2012).

Start by unpacking the discrepancy. If Isla's Star Reading is lower than you expected, look deeper at what the test actually measures. Star Reading focuses on comprehension of written passages, vocabulary, and inference. It does not measure oral retelling skill, which Isla might excel at. Comprehension on a computer screen with a timed response might feel different from comprehension in a guided reading group with think-aloud prompts. Isla might have strong reading behaviours but slower processing speed, particularly when managing the test interface. The star score is telling you "Isla processes written text at a 610L level under these specific conditions." Your observation is telling you "Isla shows sophisticated reading behaviours in guided contexts." Neither cancels the other out.
Here's how to use the discrepancy productively. Design a small formative assessment that bridges the gap. If you suspect the issue is processing speed or test format, give Isla a 610L passage in a non-timed, supported setting with you asking comprehension questions aloud. If she answers those questions accurately, the Star score reflects interface/speed friction, not comprehension ceiling. If she struggles, the Star score is a valid signal and you've now confirmed it. If Dev freezes on multi-step maths problems in the classroom but scored 680 on Star Maths (which definitely includes multi-step items), explore whether the issue is procedural confidence or engagement. Give Dev a multi-step problem without the timed pressure, with visible working space, and with permission to use manipulatives or drawings. If he solves it, the Star score reflects test anxiety or conditions-dependent performance. If he still struggles, the Star score is a valid signal that his reasoning is stronger than his multi-step execution.
These small diagnostic bridges transform Star from a numbers game into a formative assessment tool that informs your instruction. You're not dismissing Star or your own judgment; you're triangulating. And that triangulation often reveals not that someone is "miscategorised" but that a student has strengths and needs in different contexts, and good instruction meets them where they are.
Students with SEND often show high variability across domains or between ability and output. A student might have strong conceptual understanding (evidenced by explanation and reasoning) but slow processing speed (evidenced by Star Maths taking longer and covering fewer items). Another might have sight word knowledge but struggle with comprehension (Star Reading score lower than phonics knowledge would predict). Star data is valuable for these students precisely because it isolates the skill being measured.
For identification and screening, Star Reading and Star Maths are valuable tools for flagging students who might benefit from additional support. A student consistently in the 20th percentile or below warrants investigation. This doesn't mean the student has a specific learning difficulty; it means there's a gap worth understanding. Is the gap consistent across reading domains or localised to vocabulary? Is it visible in classroom observation or only on the computer-adaptive test? Is it stable or widening? These questions guide assessment and referral decisions.
For intervention planning, Star data works best as one input, not the sole input. An intervention for a student scoring 450L in Star Reading might address decoding fluency, sight word automaticity, vocabulary knowledge, or comprehension strategy depending on what classroom observation and additional assessment reveal. If you have access to item-level data from Star (some schools purchase this add-on), you can see which types of questions the student struggled with. Did they miss mostly inference questions? Vocabulary in context? These patterns guide the focus of intervention.
One critical point: Star measures what a student can do on a standardised test. It does not measure working memory load, attention span, or the support mechanisms that allow a student to function in your classroom. A student with an ADHD diagnosis might score lower on Star than their classroom performance suggests because the timed, low-stimulation computer environment doesn't include the routine, movement breaks, and multi-sensory engagement that help them regulate in the classroom. For this student, Star is one data point, not the defining one. Your accommodations and environmental strategies are equally important evidence.
For differentiation in the classroom, Star provides a clear starting point. You know each student's reading level and maths level in absolute terms, which lets you group and select materials with precision. Pair this with observation of learning behaviours, motivation, and strategy use. A group reading at 550-600L Lexile might need different support depending on whether they're all struggling with inference (strategic intervention) or a mix of decoding, vocabulary, and comprehension (broader support needed). The Lexile tells you the reading level; observation tells you what kind of instruction they need at that level.
Parents grasp percentile ranks readily. Scaled scores and grade equivalents often confuse them. You must translate these, but don't oversimplify (Hoover-Dempsey et al., 2005; Hill & Rowe, 1998). Focus on clear learner progress communication.
Start with context, not numbers. Parents care whether their child is "on track," not what a Rasch scale score of 678L means. Frame the conversation around what the test measured and what it didn't: "Star Reading measures how well your child reads and understands written passages under timed conditions. It's a valuable snapshot of their current reading level, but it doesn't capture everything we see in the classroom, like how they discuss books, predict what might happen, or ask questions when they're confused."
Then use percentile rank as your primary metric with scaled score as support: "Your son scored in the 68th percentile for Year 4, which means he's reading at a higher level than about two-thirds of children in his year group nationally. On our school's Lexile scale, that puts him at 645L, which is right where we'd expect a Year 4 reader to be in February." This gives them both the familiar percentile framing and the concrete Lexile number.
Avoid grade equivalents in parent communication unless specifically asked. If a parent pushes for "what year is he working at," you can say "He's reading at the level of a typical Year 4 student in February, which is exactly where we'd hope to see him in his Year 4 process." This reframes the grade equivalent as a national reference point, not a label.
Always pair results with classroom context: "On Star, he's strong with inference questions and vocabulary in context, which tells us his comprehension strategies are developing nicely. In the classroom, I've noticed he's starting to ask questions when he's unsure of a word, which shows growth mindset. We're going to keep him in the 640-700L range for independent reading and gradually introduce more complex texts in guided reading."
For students who scored lower than parents expected, name the dissonance and explain it: "Star Reading showed a score of 520L, which was lower than you might have expected based on what you see at home. That can happen for a few reasons: some readers process more slowly under timed conditions, some find the computer interface a bit tricky, and some show stronger reading behaviours in conversations than in silent reading tests. We're going to monitor this over the next benchmark. In the meantime, in guided reading I've noticed she's strong with character inference but sometimes misses details when scanning for information quickly, so we're working on that."
This approach makes Star data useful when it is paired with your own observations. It is not a final judgement.
Schools use Star three times yearly: autumn (baseline), spring (mid-year), summer (end-of-year). This three-point cycle gives teachers data to spot trends. Teachers then have time to act on the findings (Star, n.d.).
Autumn benchmark establishes the starting point and often feeds into class grouping, library levelling, and initial intervention identification. After autumn, most schools spend two weeks examining results, talking to children and parents, and planning adjustments. Autumn data answers: "Where is each student starting?" and "Are there any students we missed in summer assessments?" By late October, those answers are baked into your classroom organisation.
Spring benchmark (typically January or February half-term) is your progress check. This is where growth data becomes actionable. If a student or group made weak progress, you've got 4 months of summer term to shift approach. If they made strong progress, you might accelerate or deepen challenge. Spring data answers: "Is our teaching working?" and "Which interventions should we adjust or intensify?" Teachers who use Star well often meet as year groups after spring results to review growth and make decisions about intervention adjustments.
Summer benchmark is the final snapshot and the starting point for next year's team. It answers "where are students ending?" but more importantly "what does next year's teacher need to know?" A Year 4 class with strong average growth but still below national attainment tells next year's Year 5 teacher "this cohort made excellent progress but started behind; they may need continued support in reaching year group expectations." A Year 4 class with high attainment but slowing growth tells the Year 5 teacher "this cohort is strong but may be coasting; they might benefit from increased challenge."
To embed this cycle in your school:
Use learner data to sort reading groups and assign Lexile ranges in October. Find learners over one year behind and schedule initial assessments.
Spring (January/February after results): Calculate growth for each student and each group. Compare to national growth norms. Hold year group meetings to review growth data, discuss which interventions worked and which need changing, and plan summer term adjustments.
For the next team, create a cohort summary in June. Write a half-page summary for each learner. Note starting attainment, growth trend, and any concerns. Include learning behaviours (engagement, attitude, support response). Star (date not provided) shows levels, but not the learning profile.
This cycle is not complex, but it requires that schools actually use the data rather than just collect it. If results arrive in January and no one looks at them until March, the three-window advantage collapses. If results sit in dashboards and never get discussed, data becomes theatre. Effective schools build space into the calendar after each benchmark for result analysis and decision-making.
Star assesses learners' reading and maths under test conditions. It doesn't measure pleasure reading, fluency, or speaking skills. The assessment omits real-world maths and explaining maths (Wiliam, 2018). Star overlooks persistence, mindset, curiosity, and engagement with challenges (Dweck, 2006). It ignores anxiety, test skills, or tech's impact (Boaler, 2014; Hattie, 2012). Acknowledging limits prevents misinterpretation, encouraging classroom observations.
Reading fluency is perhaps the most important gap. Star measures comprehension; a student with strong comprehension but slow, choppy oral reading will still score well on Star because the test uses silent reading. This is fine for identifying comprehension level, but it misses fluency entirely. A Year 4 reader at 650L (appropriate level) who reads haltingly at 80 words per minute needs fluency intervention. Another Year 4 reader at 650L who reads smoothly at 130 words
Renaissance describes Star Assessments as a suite of reading, maths, early literacy and related assessments that combine computer-adaptive testing with reporting tools for instruction. Treat the speed and reporting features as product claims, then use classroom evidence to decide what the score means for a particular learner.
Computer-adaptive testing saves time by avoiding questions too hard or easy for each learner. The system changes difficulty, closely gauging a learner's ability (Weiss & Kingsbury, 1984). This gives precise data and cuts fatigue versus standard tests (Wainer et al., 2000).
Teachers use Lexile scale scores to match students with reading materials that offer an appropriate level of challenge. A student with a specific Lexile score can typically read texts at that difficulty with about 75 per cent accuracy. This data helps educators organise reading groups and select classroom texts that stretch reading skills without causing frustration.
Renaissance's Star Unified Scale guidance explains the use of Rasch score properties and warns against over-interpretation across different Star programmes. That is the right classroom stance: Star scores can help compare repeated assessment data, but they do not replace listening to learners read, reviewing written work, checking background knowledge or watching strategy use in normal lessons.
Do not assume that Star Maths scores perfectly show ability. Instead, see it as performance on a single day. Teachers sometimes use only percentile ranks to find learners who struggle. They must also examine the math areas where learners have gaps. Use Star Maths with classroom observation to plan help (AERA, 2023).
Star Early Literacy assesses four to six year old learners' phonemic awareness and letter recognition. Schools often transition learners to Star Reading in Year 1 or 2. This move relies on both school policy and each learner's reading readiness (Renaissance Learning, 2024).
Mathematics reasoning in context is another gap. Star Maths includes word problems and applied items, but it does not measure whether a student can identify the mathematical problem hidden in a real scenario (which item do I need to work out first?), whether they can justify their strategy to a peer, or whether they can persist with a novel problem type without a procedural template. A student who scores 680 on Star Maths can solve multi-step problems on a test. A student who blanks on a genuine mathematical problem in a project-based context might show different performance. Again, not a flaw in Star; it's a limitation of any standardised test, and you need formative, observational, metacognitive assessment of problem-solving to see the full picture.
Attitudinal and engagement factors are invisible to Star. The test format rewards speed and accuracy; it doesn't measure whether a student enjoys reading, seeks out books, or feels confident as a reader. You can have two students with identical Star Reading scores, one of whom reads voraciously at home and one who avoids reading. Star won't distinguish them. Your classroom observations, book choice surveys, and reading aloud culture will. These are essential data points for understanding reading identity, not just reading level.
Open a free account and help organise learners' thinking with evidence-based graphic organisers. Reduce cognitive load and guide schema building dynamically.
Test anxiety and neurodiversity also affect Star performance in ways the score doesn't reflect. A student with ADHD who took the test after a chaotic morning might have scored lower than their baseline. A student with test anxiety might have rushed through items and made careless errors. A student with a visual processing difference might find the screen format challenging despite strong comprehension. A student for whom English is an additional language might score lower on vocabulary-heavy items despite strong mathematics conceptual understanding if they take Star Maths. You can't see these factors in the score; you see them only by watching the student take the test or by asking them about the experience afterwards.
This is why the most effective use of Star is not to treat it as the source of truth about a student's ability but as one input into a rich triangulation: Star data (attainment and growth) plus your classroom observation and formative assessment plus feedback from students about their experience. When all three align, you have high confidence in your understanding. When they conflict, you have a clue that something important is hidden, and you dig deeper.
Star Assessments can give a consistent cohort snapshot when schools administer them carefully. Use the results to inform, not automate, classroom decisions. Run benchmarks according to your school's assessment calendar, review scores promptly, group learners cautiously, compare growth with the current Star reports, and always link the score to what you have observed in lessons.
The strongest schools use Star to hand every teacher and every student a clear picture of reading and mathematics progress, then use that picture to inform instruction, not replace it. Your professional judgment, your knowledge of your students, and your formative assessment remain central. Star is the precision tool that lets you zoom in on level and growth; observation, conversation, and formative assessment are what let you see why and what to do about it.
Start with autumn benchmark. Use those results to place students in the right Lexile/scale range for their materials. Run spring benchmark three months later, calculate growth, and use that insight to adjust interventions or accelerate challenge for strong progressors. Pair every Star score with "what did I observe this week in reading/maths instruction?" and "what does this student need to progress further?" If you answer those questions consistently, Star becomes what it was designed to be: a formative assessment tool that illuminates what's working and what needs changing.
Prior research shows varying perspectives on the best teaching approaches. Hattie (2008) found feedback significantly improves learner outcomes. Conversely, Kirschner, Sweller, and Clark (2006) advocate explicit instruction. Didau and Rose (2016) promote knowledge-rich curricula. These studies inform practice, impacting learner progress daily.
These sources replace the fabricated and future-dated research items previously shown here. Use Renaissance sources for product-specific claims and independent research or official reports for adaptive testing, Lexile matching and formative-assessment principles.
Star Assessments View official product page
Renaissance Learning.
Use this for the current Star suite, reporting features and the vendor's description of computer-adaptive assessment. Do not use it as independent proof that a classroom intervention caused a score change.
Research Foundation for Star Adaptive Assessments: Science of Star View Renaissance research page
Renaissance Learning. Updated 2020.
This vendor research page is the appropriate source for Star's own account of item response theory, calibration, growth measurement, linking studies, reliability and validity information.
Star Assessments for Reading Technical Manual View technical manual page
Renaissance Learning support documentation.
Use this for technical detail on Star Reading. It is more precise than generic author-date claims about what the assessment measures.
Star Unified Scale View scale guidance
Renaissance Learning support documentation.
The scale guidance is useful for Rasch-score and unified-scale wording, including the important caveat that scores should not be over-interpreted across different Star programmes.
The Lexile Framework for Reading View MetaMetrics PDF
MetaMetrics.
This is the safer source for explaining Lexile measures, the shared reader/text scale and the 75 per cent comprehension convention. It should be paired with teacher judgement about interest, knowledge and context.
Application of Computerized Adaptive Testing to Educational Problems View university record
Weiss, D. J. and Kingsbury, G. G. (1984). Journal of Educational Measurement, 21(4), 361-375.
This peer-reviewed paper is a better anchor for computer-adaptive testing than the fabricated Star-specific author/year claims removed from the article.
Preventing Reading Difficulties in Young Children View National Academies record
Snow, C. E., Burns, M. S. and Griffin, P. (eds.) (1998). National Research Council.
Use this official report for the caution that reading assessment data should be combined with broader evidence about reading development and instruction.
Assessment and Classroom Learning View university-hosted PDF
Black, P. and Wiliam, D. (1998). Assessment in Education: Principles, Policy and Practice, 5(1), 7-74.
This review supports the article's central classroom point: assessment is valuable when teachers use evidence to adapt teaching, not when numbers are treated as labels.