Updated on
September 21, 2026
How Many Personality Types Are There? 16, 9 or None at All
There is no single count of personality types. Compare MBTI's 16, the Enneagram's 9 and the Big Five's five continuous traits, with guidance for schools.


Updated on
September 21, 2026
There is no single count of personality types. Compare MBTI's 16, the Enneagram's 9 and the Big Five's five continuous traits, with guidance for schools.
How many personality types are there?
There is no single scientific count of personality types. MBTI sorts people into 16 types and the Enneagram proposes 9, while the Big Five measures five continuous traits rather than types. Some data-driven studies find recurring clusters, but they do not establish a universal set of fixed boxes. Schools should use profiles, if at all, as reflection prompts rather than learner labels or teaching prescriptions.
There is no single scientific count of personality types. The Myers-Briggs Type Indicator (MBTI) sorts people into 16 categories, and the Enneagram proposes 9 types. The Big Five measures five continuous traits rather than types. These numbers come from different models, not from competing counts of one agreed set of natural boxes.
Some large datasets show recurring clusters of trait profiles (Gerlach et al., 2018). This does not prove that everyone belongs to a fixed type. In schools, a profile may prompt reflection. It should not label a learner, determine a group or prescribe teaching.
Key takeaways
There are 16 types in MBTI and 9 in the Enneagram, but science does not recognise one final number of personality types. The Big Five describes five broad dimensions, and other models use different structures. The answer therefore depends on what a framework means by personality.
The apparent disagreement is partly a disagreement about the question. MBTI asks which side of four preference pairs best describes a person. The Enneagram uses nine named patterns organised around motives and fears. The Big Five asks how much of each broad trait a person tends to show.
Why do some sources say four? Some commercial systems use four labels, often A to D. Gerlach et al. (2018) also found four dense clusters in Big Five data. These are different claims. Neither establishes four universal personality types.
Personality also includes patterns rather than rigid rules. A learner may be sociable with close friends, quiet during unfamiliar group work and confident when explaining a favourite subject. Context, development, culture, mood and the task all affect what a teacher sees.
This article compares three prominent frameworks. A wider history and map of competing approaches belongs in our guide to personality theories. Clinical personality disorders are outside this article's scope and require qualified assessment, not a school questionnaire.
A personality type puts a pattern into a category. A personality trait records how much of a quality someone shows. Types ask, “Which group fits best?” Traits ask, “Where does this person sit on several scales?” That difference changes how results should be read.
A type model creates a boundary between categories. Imagine two people whose scores fall just either side of an MBTI cut point. They may receive different letters even though their answers were very similar. Meanwhile, two people with the same letter may sit far apart within that preference range.
Categories can be memorable. They give people shared language and may make a discussion easier to start. The cost is compression. A label hides uncertainty, strength of preference and variation within the group.
A trait model keeps more of that variation. Someone can be moderately extraverted, highly conscientious and near the middle on openness. There is no need to decide that the person is wholly one thing or its opposite.
Continuous scores also allow researchers to examine patterns across large samples. They still depend on the measure, the comparison group and the quality of the response. A score is an estimate, not a complete account of character.
MBTI creates 16 categories from four preference pairs: extraversion or introversion, sensing or intuition, thinking or feeling, and judging or perceiving. A four-letter result shows the chosen side of each pair. It does not measure intelligence, attainment, mental health or a preferred way to learn.
Combining one letter from each pair produces 16 possible labels. That arithmetic is clear. What needs caution is the step from a score to a sharply bounded kind of person.
The 16 labels are ISTJ, ISFJ, INFJ, INTJ, ISTP, ISFP, INFP, INTP, ESTP, ESFP, ENFP, ENTP, ESTJ, ESFJ, ENFJ and ENTJ. This list shows the possible letter combinations. It does not validate the boundaries between them.
McCrae and Costa (1989) compared MBTI results with the five-factor model. Several MBTI scales related to broader personality traits. The results did not support distinct, natural types. The variation looked more like a set of scales than separate categories.
Pittenger (1993) reviewed the MBTI's value and warned against claims that go beyond its evidence. A result may give adults words for a voluntary discussion. It does not show that the categories predict performance or identify the right teaching for one person.
An adult team can use the prompts to discuss meetings or decisions. The value comes from the conversation, not from assuming the code has uncovered a hidden essence.
For learners, the threshold should be higher. A school should not place learners into “thinking” and “feeling” groups, infer ability from a letter code or claim that one type needs visual teaching. MBTI is not a learning-styles instrument. These sources do not show that matching teaching to a type improves learning.
Readers interested in the individual dimension can explore introversion and extraversion. See Jungian psychology and Jung's archetypes for the intellectual background.
The Enneagram proposes nine personality types, usually described through characteristic motives, fears and patterns of attention. Many versions add wings, arrows or movement between types. These ideas can feel personally meaningful, but the research base is mixed and does not justify fixed labels or school decisions.
The Enneagram aims to explain why a person tends to act as they do. Two people can show the same behaviour but receive different labels because the proposed motive differs. This may feel insightful, yet motives are harder to measure well than visible choices.
Hook et al. (2020) reviewed the Enneagram research. Evidence for reliability and validity was mixed, and measures differed greatly. The review found some support for parts of the nine-type structure. Evidence for wings and movement between types was limited.
A prompt about what a person avoids, values or notices may support thoughtful discussion. A school must still separate personal resonance from scientific support.
If an adult voluntarily explores an Enneagram description, invite them to test it against real examples and alternatives. Which parts fit? Which do not? Does the account change across roles and situations?
What evidence would make the person revise the interpretation?
Do not ask learners to disclose fears or motives to classmates. Do not treat an Enneagram number as an explanation of behaviour, a pastoral diagnosis or a forecast of achievement. A learner's own account, observed circumstances and professional assessment carry more weight.
The Big Five has five broad traits, not five personality types. It measures openness, conscientiousness, extraversion, agreeableness and negative emotionality on continuous scales. Every person receives a profile across all five dimensions, so the framework does not require a single box or a fixed count of kinds.
A person can score higher than a comparison group on conscientiousness, around the middle on extraversion and lower on negative emotionality. Another person can have a different combination. Even with only five dimensions, the possible profiles are numerous because each scale contains degrees.
Soto and John (2017) developed and tested the BFI-2. It measures the Big Five through 15 more specific facets. Their work shows how trait research tests a measure's structure, reliability and power to predict, rather than merely giving people appealing names.
The Big Five has the strongest research base of the three frameworks compared here. That does not make every questionnaire equally good. It also does not turn a broad trait score into a diagnosis or direct account of why one learner struggled with a task.
For a fuller explanation of each dimension, see our guide to the Big Five personality traits. Historical shorthand such as Type A and Type B belongs to its own evidence and should not be mixed with the five-factor model.
Gerlach et al. (2018) analysed four large datasets and identified four recurring clusters within Big Five profiles. Some combinations can occur at denser points in a dataset. This does not prove that humanity contains exactly four fixed types.
Clusters can depend on the variables, sample and statistical method. They describe concentrations, not hard walls. People near a cluster boundary do not become fundamentally different because an algorithm assigns them to different groups.
Trait dimensions do not stop researchers from finding patterns. Yet those patterns do not establish one universal taxonomy or allow schools to label learners.
MBTI and the Enneagram offer memorable categories. The Big Five keeps differences of degree. Each model asks a different question and has a different evidence base. The table compares them without turning any model into a teaching recipe.
On a smaller screen, swipe across to read all columns.
| Comparison | MBTI | Enneagram | Big Five |
|---|---|---|---|
| Unit | Four-letter category from preference pairs | Named type centred on patterns of motivation | Profile across continuous traits and facets |
| Number | 16 types | 9 proposed types | 5 broad dimensions, not types |
| Evidence position | Related to dimensions, but hard categories and strong utility claims are contested | Mixed evidence, with limited support for several secondary features | Strongest research base of these three for describing broad traits |
| Useful question | Which preference language helps a voluntary discussion? | Which motives or patterns are worth reflecting on? | What relative tendencies does this measure estimate? |
| Unsafe use | Assigning instruction, roles, ability or groups from a type | Inferring hidden motives, wellbeing or behaviour from a number | Turning an association into an individual forecast or teaching prescription |
A polished report or a person's sense of recognition is not the same as a sound measure. Stronger evidence comes from independent studies of reliability, validity and links with outcomes. Even then, a group trend is not certainty about one person.
Personality traits can show links with academic performance, but they do not determine attainment. A group trend is not an accurate forecast for one learner. Prior knowledge, teaching, attendance, opportunity, health, motivation and task design also shape what happens.
Mammadov (2021) reviewed research on Big Five traits and academic performance. Traits were linked with performance, and conscientiousness had the strongest consistent link. A link does not show that a trait caused one result. It also does not show that matching teaching to a profile will improve learning.
Suppose a group study links conscientiousness with grades. A teacher still cannot infer why one learner missed homework. The learner may have misunderstood the task, lacked a quiet place, faced caring duties or forgotten the deadline.
The useful next step is to investigate the barrier. Check understanding, resources, routines and workload. Agree a manageable action, then review whether it helped. Calling the learner “low conscientiousness” adds little and may close down better explanations.
The same principle applies to participation. A quiet learner may need thinking time, language support, clear instructions or safety. They may simply prefer not to speak first.
Offer a short written rehearsal and varied response routes to everyone. Do not put learners into introvert and extravert groups.
Responsive teaching starts with evidence from the task. Formative assessment identifies what has been understood. Learner voice adds context.
Work samples reveal patterns. These sources are more actionable than a broad personality label because they connect directly to the learning goal.
A preference for discussion does not prove that a learner learns only through talk. Enjoying structure does not make open inquiry impossible. Learners often need to practise new ways of thinking. The best response mode can change with the subject and purpose.
Plan accessible options where they support the goal. A class can think silently, discuss in pairs, build an explanation and then choose a spoken or written check. This is responsive differentiation based on barriers and evidence, not personality matching.
Type systems turn complex patterns into memorable labels. This can prompt reflection, but it can hide doubt, variation and change. The main risks are false boundaries, unstable results, self-fulfilling labels, weak predictions and uses the survey was not built to support.
A cut point converts a small score difference into a different label. Readers may then assume people in separate categories are opposites, while overlooking wide differences within the same category. This is especially misleading when the underlying responses vary continuously.
Self-report surveys ask people to describe themselves across settings. Answers can change with wording, recent events, social pressure and the role a person has in mind. A report should state its limits and never present the result as permanent.
Once people receive a label, they may notice examples that fit and discount those that do not. Our guide to cognitive biases explains why a vivid description can feel more complete than the evidence.
Adult expectations can magnify the problem. If a learner is called a “perceiver”, staff may treat late work as personality rather than checking planning, clarity or support. The label becomes an explanation before alternatives are tested.
Good design, familiar words and team enthusiasm can make a tool engaging. They do not prove that it is reliable, valid or fair for a new purpose. Leaders should ask for the manual, validation evidence, intended users, known uncertainty and limits on use.
No framework in this article should be used as a clinical diagnosis, an explanation of attainment, a learning-style measure, a selection test or evidence that a learner cannot change. Those claims require different evidence and, in some cases, qualified professionals.
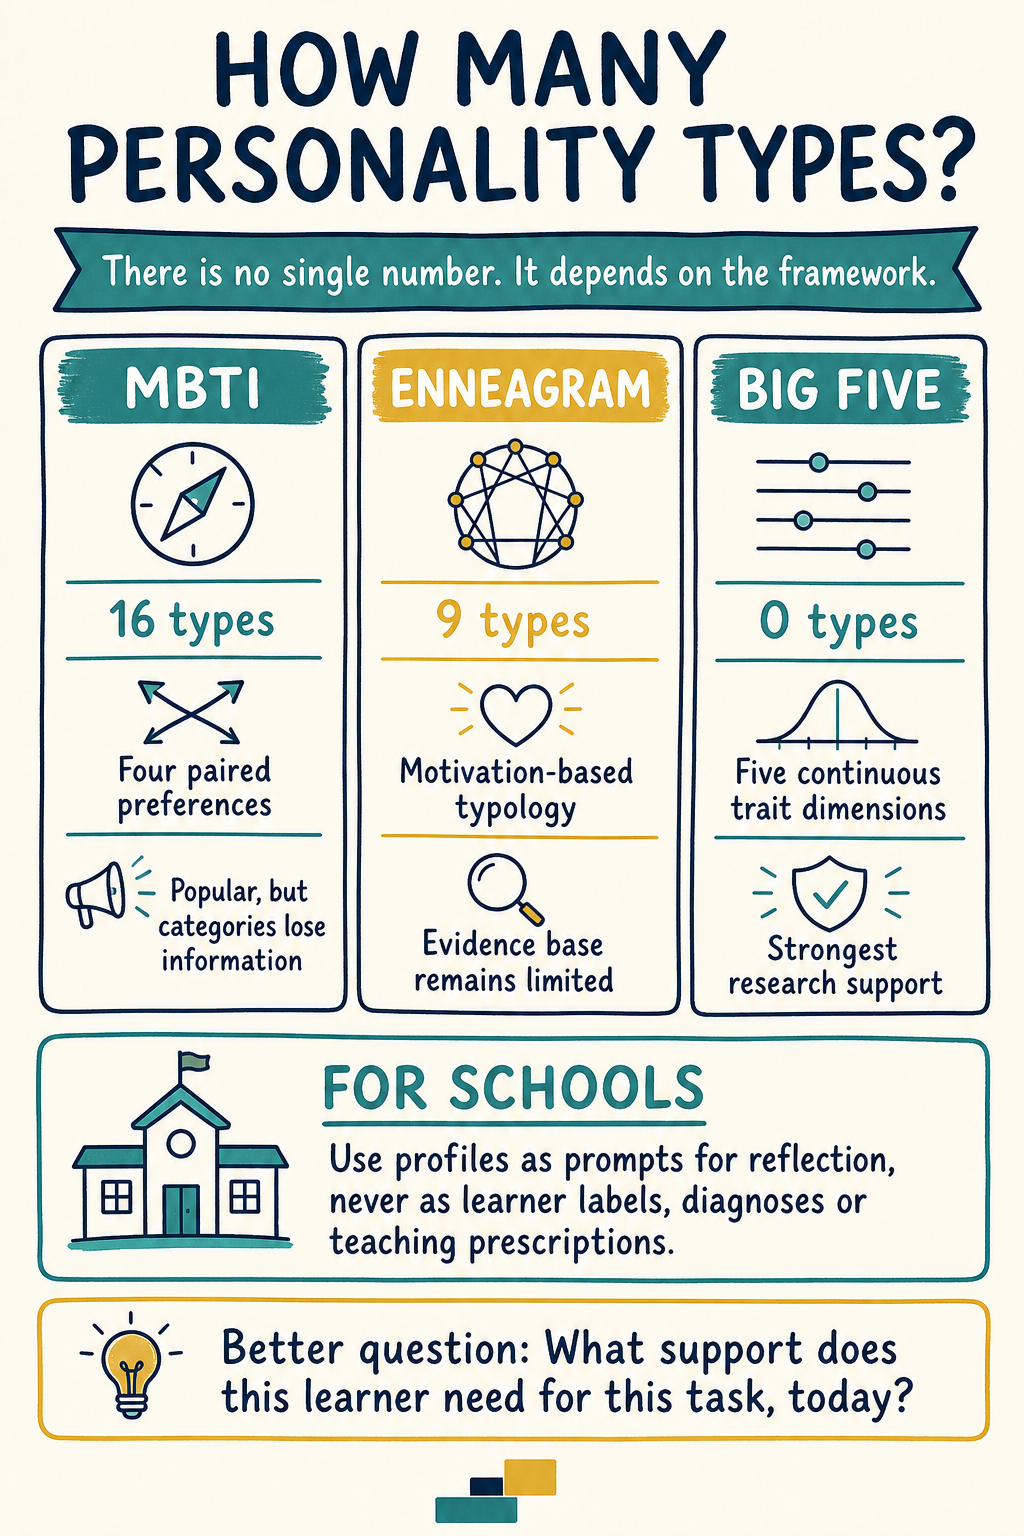
Personality types study note. Use the preview for a quick comparison, or open the full-size PNG to zoom in.
How many personality types are there? There is no universal scientific count. MBTI reports 16 categories from four preference pairs.
The Enneagram proposes 9 types focused on motives and patterns. The Big Five measures five continuous traits, not five types.
Types compared with traits: a type places a person in a named category; a trait records degree on a scale. Categories are memorable but can create false boundaries. Trait profiles preserve more variation but remain estimates rather than diagnoses.
Evidence: Big Five measurement has the strongest research base of these three. MBTI scales relate to dimensions, but sharp type boundaries and strong utility claims are contested. Enneagram evidence is mixed, and support for wings and movement is limited. Statistical trait clusters do not prove one fixed set of human types.
For schools: use any profile only for voluntary, confidential reflection. Never infer ability, SEND, behaviour, mental health or a learning style. Never select, group or prescribe teaching from a label. Base support on observed task performance, formative assessment, learner voice and review.
Schools should use personality frameworks, if at all, as optional prompts for reflection. Any learner activity needs firm limits. Results must stay private and low stakes. They must not affect admissions, setting, SEND decisions, behaviour judgements, subject choices, staffing or access to opportunity.
Ask what decision the school is trying to improve. If the aim is better teaching, current assessment and observation are usually more relevant. If the aim is team reflection, a structured discussion may work without collecting or storing personality data.
Do not use a survey merely because it is popular or easy to run. Curiosity does not justify collecting personal data from children. Before buying a tool, leaders should set its educational purpose, lawful handling, retention period, access controls and route for challenge.
Explain what the tool can and cannot show. Allow people to decline without penalty and keep results private. Do not require public disclosure, display type labels or ask staff to interpret a learner's motives.
For younger learners, ask whether safer questions can meet the same aim. “What helps you join a discussion?” is clearer and more useful than “Which personality type are you?”
Do not use results to select leaders, allocate classes, set targets or screen for SEND. Do not treat a profile as evidence of attitude or potential. If concern involves mental health, neurodevelopment or safeguarding, follow the appropriate professional pathway.
Procurement checks should cover the instrument's intended age group, validation evidence, accessibility, data processor, deletion process and marketing claims. A vendor should be able to explain uncertainty and unsuitable uses, not only produce attractive reports.
Offer useful conditions across the class. Give quiet planning time before discussion. Use clear models and room to explore. Let learners rehearse with a partner before sharing.
Provide more than one suitable route to show understanding where the learning goal permits it.
These choices meet common needs without deciding who is an “introvert”, “intuitive” or “Type 5”. Review their effect through work and feedback. A support that helps today can change tomorrow.
For example, a Year 8 class may need to explain a text. Give all learners one minute to jot down a first thought. Ask pairs to test each idea, then invite a few to share.
Let the final check be a short note or a spoken answer. This plan gives quiet thought, talk and choice without sorting the class by type. Look at the work.
If key points are missed, teach them and check again. The next step comes from what learners show, not from a profile.
Use a growth mindset carefully too. It should invite sound strategies and progress, not imply that a learner can beat each barrier through attitude. Our Learning Theories hub covers learning in more depth. It keeps personality description apart from teaching evidence.
The short answers below separate what each framework claims from what the evidence permits. They are designed for quick reference, but the same rule runs through them all: a personality result can describe tendencies or start reflection, not determine identity, ability or teaching.
There is no single scientific count. MBTI sorts results into 16 categories, and the Enneagram proposes 9 types. The Big Five measures five continuous dimensions rather than types. Other frameworks organise personality differently, so their numbers are not counts of one agreed natural set.
Of MBTI, the Enneagram and the Big Five, the Big Five has the strongest research base for measuring broad personality traits. It still provides a descriptive profile, not a diagnosis, an explanation of attainment or an individual teaching plan.
MBTI may provide clear language for voluntary, low-stakes reflection, especially among adults. Its type boundaries and strong predictive uses are contested. Schools should not infer ability, assign learning tasks or group learners from a four-letter result.
The evidence is mixed. A systematic review found varied reliability and validity across instruments, with some support for parts of the core nine-type structure. Evidence for wings and movement between types was limited. Personal resonance should not be mistaken for validation.
Big Five traits show group-level associations with academic performance, but they do not determine an individual's result. Prediction is limited by context and many other influences. Teachers should investigate current barriers through assessment, observation and learner voice.
Keep any use voluntary, confidential and low stakes. Explain uncertainty, check the tool and its data handling, and exclude results from selection, grouping, behaviour, ability and SEND decisions. Base support on observed needs, task demands and reviewed classroom evidence.
These six sources support the article's comparison of type and trait models, sound measurement, links with attainment and large trait clusters. This list is limited to the works cited in the body.